
Your maintenance backlog hit 847 work orders last Tuesday. The operations director wants it cleared by quarter-end. Your lead tech just mentioned three people are looking at other jobs because weekend overtime became standard practice.
This exact scenario played out at a pharmaceutical facility in New Jersey where management tried the "all hands on deck" approach. They pushed their 14-person crew to 60-hour weeks. The backlog dropped from 900 to 400 orders in eight weeks. Then four technicians quit, two got injured from fatigue-related mistakes, and the backlog ballooned back to 1,100 within three months because nobody was doing preventive work anymore.
The pressure to eliminate backlogs creates a brutal cycle. Push harder, lose people, backlog grows worse. Most facilities treat backlog reduction like a sprint when it's actually a marathon that requires protecting your runners.
Why traditional backlog attacks fail within 90 days
Maintenance managers default to three broken strategies when facing massive backlogs. First comes the overtime surge—throw money and hours at the problem until something breaks. Second, they hire temporary contractors who don't know the equipment and create rework. Third comes the dreaded "deferred maintenance" approach where you pretend certain issues don't exist until they cause failures.
A food processing plant in Ohio tried all three simultaneously. They brought in eight contractors, mandated weekend overtime, and pushed non-critical work into next year's budget. The contractors misaligned three packaging lines because they didn't understand the facility's unique modifications. The overtime led to a senior tech making a valve sequencing error that contaminated an entire batch. The deferred maintenance resulted in a glycol chiller failing during peak summer production.
The math looked good on paper—backlog reduced by 62% in ten weeks. The reality included hundreds of thousands in rework, two OSHA recordables, and turnover that took eighteen months to stabilize.
Backlogs form through predictable patterns. Emergency work displaces planned maintenance. Technicians skip documentation to save time. Parts delays stack up incomplete orders. Poor scheduling creates artificial bottlenecks where five techs wait for one specialty tool. Each factor compounds until you're drowning in deferred work while your team burns out trying to stay afloat.
Phase 1: Ruthless scope reduction and honest triage
Before adding resources or mandating overtime, you need surgical precision on what actually needs doing. Most backlogs contain 30-40% zombie work orders—duplicates, already-completed tasks, or issues that no longer exist.
Eliminate downtime with proactive maintenance.
Openfixit helps you plan, track, and complete maintenance efficiently—maximizing asset reliability.
- Centralized asset management
- Automated maintenance scheduling
- Inventory and parts tracking
No credit card required
Start with a work order audit spreadsheet:
| Category | Typical % of Backlog | Action | Example |
|---|---|---|---|
| Duplicates | 8-12% | Delete immediately | Same bearing replacement entered 3 times |
| Obsolete equipment | 5-8% | Cancel and archive | Work orders for decommissioned Line 4 |
| Already completed | 10-15% | Close with notes | Tech fixed but didn't update system |
| No longer needed | 7-10% | Verify and cancel | Temporary fix became permanent solution |
| Scope creep | 15-20% | Split or reduce | "Replace motor" became "rebuild entire conveyor" |
A paper mill discovered 31% of their 600-order backlog fell into these categories. They cleared 186 orders in two days just through honest assessment.
Next comes brutal prioritization using a simple scoring matrix:
Safety Impact (0-5 points)
-
5
Immediate injury risk
-
3
Potential safety issue
-
1
Minimal safety concern
-
0
No safety impact
Production Impact (0-5 points)
-
5
Complete line stoppage
-
3
Significant slowdown
-
1
Minor inefficiency
-
0
No production effect
Regulatory/Compliance (0-5 points)
-
5
Violation if not addressed
-
3
Audit finding likely
-
1
Best practice issue
-
0
No compliance impact
Start the audit with the highest-volume requestors to quickly surface duplicates and already-completed orders.
Anything scoring below 6 total points gets pushed to a "Phase 3" list that you'll address after stabilizing. This typically eliminates another 25-30% from immediate consideration.
Setting workload guardrails that actually protect technicians
An automotive plant in Kentucky thought they were being reasonable. Twelve-hour days, sure, but only Monday through Friday. Voluntary Saturday overtime with double pay. Nobody forced to work Sundays.
Six weeks later, their most experienced controls technician made a programming error that stopped the paint line for fourteen hours. Investigation showed he'd worked 71 hours that week and made the mistake at hour 68. The production loss exceeded the entire overtime budget for the quarter.
Real workload limits need teeth:
-
Maximum 50 hours per week averaged over 4 weeks
-
No more than 6 consecutive days worked
-
Mandatory 24-hour break after 3 consecutive 10+ hour days
-
No critical work assigned after hour 45 in any week
Soft limits with approval gates:
-
Hours 51-55 require supervisor approval
-
Hours 56-60 require manager and tech voluntary agreement
-
Beyond 60 prohibited except documented emergency
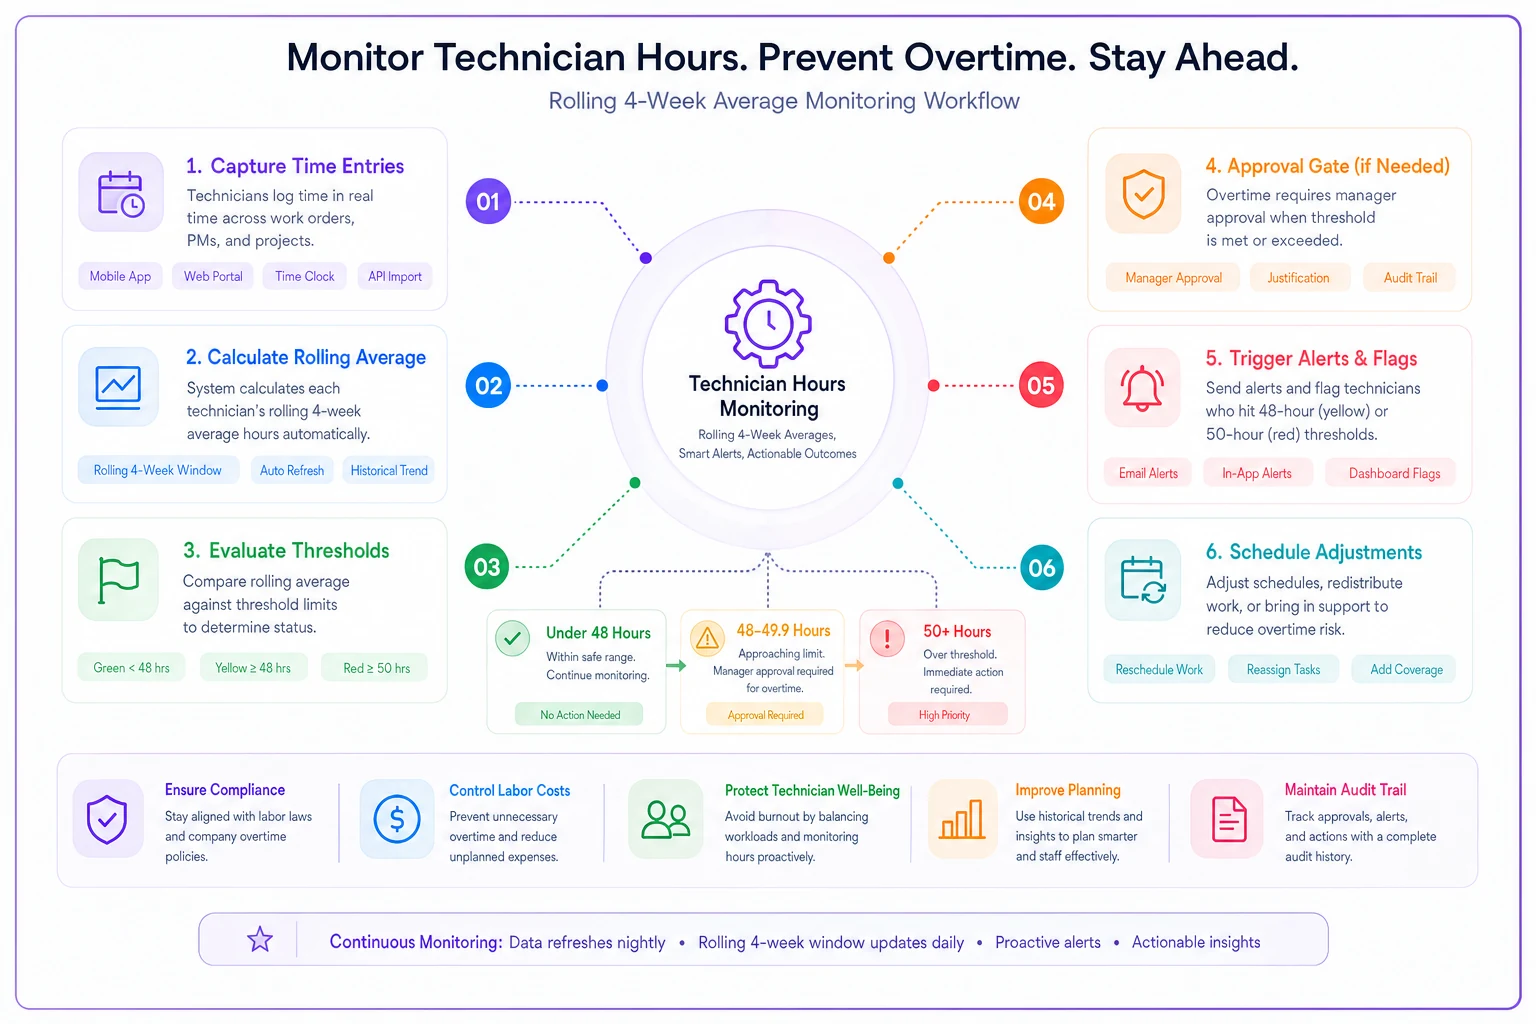
Track these limits through a simple spreadsheet showing rolling 4-week averages. When someone hits 48 hours average, they get flagged yellow. At 50 hours, they're red and cannot be scheduled for overtime without division manager sign-off.
A chemical facility implemented these limits during a 500-order backlog reduction. They took four months instead of the planned two, but retained their entire crew and had zero safety incidents. The facilities that rushed through in 6-8 weeks typically saw 20-30% turnover and multiple recordable injuries.
Phase 2: Strategic contractor deployment without the usual disasters
Contractors fail when you treat them like temporary versions of your regular techs. They don't know your equipment quirks, your undocumented modifications, or why valve 47B must never be fully closed even though the P&ID says it's fine.
The right approach segments work specifically for contractor capabilities:
-
Painting and insulation repair
-
Standard bearing replacements
-
Basic lubrication routes
-
Filter changes and cleaning
-
Non-critical pump rebuilds
-
Scaffold support work
-
Simple electrical terminations
Never assign to contractors:
-
Control system modifications
-
Critical equipment alignment
-
Permit-required confined space
-
Proprietary equipment repair
-
Undocumented system work
Create contractor work packages with excessive detail. Where your tech's work order says "replace bearing on conveyor 5," the contractor package includes photos of the exact bearing, torque specifications, alignment procedures, and post-work verification steps. Takes an extra hour to create but prevents eight hours of rework.
Pair each contractor with a facility tech for the first week—not to work together, but for question access. The contractor works independently but knows exactly who to ask about facility-specific issues. A printing facility reduced contractor rework from 18% to 4% just by implementing this buddy system.
Budget 60% productivity from contractors compared to your regular techs. If your tech completes eight work orders daily, expect five from a contractor. This realistic expectation prevents the scheduling pressure that creates mistakes.
Measuring progress without destroying morale
The worst backlog metrics focus purely on closure rate. "We closed 87 work orders this week!" Meanwhile, 94 new ones arrived and your team worked themselves into exhaustion chasing a meaningless number.
Effective measurement tracks three parallel metrics:
Backlog days = Total backlog hours ÷ Available weekly hours
This shows realistic time-to-clear without overtime. If you have 3,000 backlog hours and 400 available weekly hours, you're looking at 7.5 weeks minimum. This grounds expectations in reality.
Work order age distribution:
| Age Category | Target % | Warning Level |
|---|---|---|
| 0-7 days | 40% | Below 25% |
| 8-30 days | 35% | Above 45% |
| 31-60 days | 15% | Above 25% |
| 60+ days | 10% | Above 20% |
Track the percentage of work orders in each category weekly. If your 60+ days category grows despite closing orders, you're not actually reducing the backlog—just churning easy work while critical items age.
Team health score:
-
Average hours worked past 4 weeks
-
Overtime volunteer rate (% saying yes when asked)
-
Near-miss reports per week
-
Rework percentage
-
Team meeting attendance
Weight these equally and track the trend. When the health score drops below 70%, pause aggressive reduction efforts and focus on stability.
A pharmaceutical facility tracked these metrics during a six-month backlog reduction from 1,100 to 300 orders. They paused three times when team health dropped, extending the timeline but maintaining full staffing and morale throughout.
The hidden cost of rushing: rework that doubles your problem
Speed kills quality in maintenance. A rushed bearing replacement becomes a shaft replacement next month. A quick control panel cleaning becomes a failed component from moisture intrusion. An abbreviated startup check becomes an emergency shutdown at 2 AM.
Industrial facilities average 8-12% rework during normal operations. During aggressive backlog pushes, this jumps to 20-35%. Every rushed job potentially creates 1.3 future work orders.
Document rework religiously during backlog reduction:
-
Original work order number
-
Initial completion date
-
Rework discovery date
-
Root cause (rushed, incorrect procedure, wrong parts, etc.)
-
Hours required for rework
-
Additional costs incurred
A metal fabrication shop discovered their two-month backlog "elimination" actually increased total maintenance hours by 22% over six months due to rework. They would have finished faster by working at a sustainable pace from the start.
Build in quality checks for any work completed under backlog pressure:
-
Supervisor spot-check 20% of completed work orders
-
Mandatory photos for bearing replacements and alignments
-
Vibration checks on all rotating equipment work
-
Test runs before closing critical equipment orders
-
Follow-up inspection within 7 days for safety-critical repairs
These checks add 10-15% to completion time but prevent the 30-40% rework penalty from rushed jobs.
Phase 3: The sustainable steady state that prevents future avalanches
After the crisis passes, most facilities return to the exact patterns that created the backlog. PMs get deferred during busy periods. Documentation stays poor. Emergency work continues disrupting schedules.
Breaking this cycle requires systematic changes, not heroic efforts:
Weekly backlog review meetings (30 minutes max):
-
Review anything over 30 days old
-
Identify resource bottlenecks
-
Flag scope creep immediately
-
Cancel or defer low-priority items
-
Assign clear owners to aging orders
Backlog budget allocation: Each week, reserve 20-30% of available hours specifically for backlog reduction. If you have 400 maintenance hours weekly, 80-120 go toward backlog regardless of other demands. This prevents the accumulation that creates crises.
Automatic escalation triggers:
-
Work order over 45 days
Supervisor review required
-
Over 60 days
Manager approval to continue deferral
-
Over 90 days
Division manager briefing on why it remains open
-
Over 120 days
Automatic elevation to safety/compliance review
PM protection protocols: Create a formal process for deferring preventive maintenance. Skipping a PM requires:
-
Written justification
-
Risk assessment for deferral
-
Revised completion date
-
Approval at manager level
This friction prevents casual deferrals that compound into major backlogs.
When temporary measures become permanent dysfunction
A food processing facility started their backlog reduction with "temporary" Saturday coverage. Just until we catch up. Six Saturdays became twelve. Twelve became "permanent voluntary overtime available." Two years later, they couldn't function without weekend work because they'd never addressed the underlying capacity problem.
Set explicit sunset dates for all temporary measures:
-
Contractor support ends [specific date]
-
Overtime authorization expires [specific date]
-
Deferred PM catchup completed by [specific date]
-
Return to standard metrics on [specific date]
When you reach these dates, actually stop. If the backlog isn't managed, that's valuable data about structural problems. Maybe you need two more permanent technicians. Maybe your PM frequencies need adjustment. Maybe emergency work needs better root cause analysis. But you'll never find out if temporary bandaids become permanent fixtures.
Backlog reduction automation and workflow optimization
Modern maintenance operations increasingly rely on AI-powered operational software to prevent backlogs from forming in the first place. These platforms automatically prioritize work orders based on equipment criticality, track technician workload in real time, and flag when someone approaches overtime limits before it becomes a problem.
The real value comes from pattern recognition. Good operational software identifies which equipment generates excessive emergency work, which technicians need specific training, and which spare parts create consistent delays. Instead of reacting to backlog crises, you start preventing them through smarter scheduling and automated routing that accounts for skills, current workload, and equipment history.
These platforms also track rework patterns and flag when rushed work creates downstream problems. If bearing replacements completed during overtime show higher failure rates, you can restrict complex work to normal hours—protecting quality without sacrificing throughput.
None of this replaces the fundamentals covered above. But it does make the fundamentals easier to enforce consistently, especially across larger crews or multiple facilities.
Building a backlog-resistant maintenance culture
A manufacturing plant in Tennessee hadn't seen a backlog over 200 orders in three years. Not because they worked harder—they averaged around 42 hours per week with minimal overtime. They simply refused to normalize dysfunction.
When emergency work spiked, they investigated root causes instead of just fixing symptoms. When a tech suggested deferring PMs to catch up on repairs, the supervisor asked, "What happens in six months when those PMs turn into emergencies?" When management pushed for faster closure rates, the maintenance manager showed them rework data from facilities that had rushed.
Cultural elements that prevent backlogs:
-
Transparency about reality Post your backlog metrics where everyone sees them. Not to shame anyone, but to maintain awareness. When people see the number climbing, they naturally adjust behaviors before crisis hits.
-
Protected PM time Some facilities literally lock out emergency work orders on specific mornings. Those blocks are sacred for preventive maintenance. Operations learned to plan around these windows because the alternative was random failures at worse times.
-
Rework ownership If a tech's rushed work requires rework, they own the fix—during regular hours, properly scheduled. This creates natural pressure for quality without punitive measures.
-
Management backstop When operations pushes for unsafe acceleration, maintenance management must shield their teams. "We can work safely at X pace or unsafely at Y pace. Which do you prefer on record?" usually ends the conversation.
When operations pushes for unsafe acceleration, maintenance management must shield their teams. "We can work safely at X pace or unsafely at Y pace. Which do you prefer on record?" usually ends the conversation.
That New Jersey pharmaceutical facility eventually figured it out. After their fourth attempt at forced backlog reduction failed, they implemented workload limits, honest triage, and systematic prevention. It took eight months instead of eight weeks, but their backlog stabilized under 100 orders and stayed there for two years.
They didn't work harder or hire more people. They worked sustainably, protected their team, and addressed root causes instead of symptoms. Their technicians stopped job hunting. Their rework dropped to around 6%. Their emergency work decreased because PMs actually got done.
Backlog reduction isn't about heroic efforts. It's about systematic improvement that protects your people while gradually solving the actual problem. Set realistic timelines. Enforce workload limits. Measure what matters. Fix it once instead of twice.
The facilities that "successfully" eliminate backlogs through unsustainable pushes usually face larger backlogs within a year, plus turnover, injuries, and cultural damage that takes years to repair. The ones that reduce maintenance backlog sustainably through protected, phased approaches maintain those improvements indefinitely.
Your backlog didn't form overnight and won't disappear through force. Choose the path that gets you there with your team intact, even if it takes a few months longer. The alternative is a pyrrhic victory that leaves you worse than when you started.
Ready to optimize your maintenance operations?
Join 2,000+ facilities using Openfixit to reduce unplanned outages, extend asset life, and improve operational efficiency.