

Most facility managers schedule preventive maintenance based on manufacturer recommendations or round calendar intervals—monthly, quarterly, annually. Makes sense on paper. Except those intervals were designed to protect equipment warranties, not minimize your total operational costs.
Why standard PM intervals create cost traps
Manufacturer recommendations assume average operating conditions. Your facility doesn't have average conditions. A rooftop unit in Phoenix runs differently than one in Seattle. An air handler serving a clean office operates differently than one filtering a manufacturing floor.
When maintenance teams follow generic schedules, three cost patterns tend to show up:
Over-maintenance bleeding labor budget Equipment that could run 180 days between service gets checked every 90. Each unnecessary PM costs somewhere in the $85–120 range in labor. Multiply that across 40 assets with similar over-servicing, and you're burning $13,000–19,000 annually on redundant checks.
Under-maintenance triggering emergency repairs A critical pump scheduled for annual service fails at month ten. Emergency repair runs $2,800 versus $450 for planned replacement. Add overtime labor at 1.5x rate, expedited parts shipping, and production downtime—that single failure can easily cost $4,000+ more than proper PM would have prevented.
Parts replacement on time, not condition Filters changed monthly regardless of differential pressure. Belts replaced annually whether worn or not. This kind of rigid scheduling wastes roughly 35% of parts budget based on what shows up repeatedly across manufacturing and commercial facilities.
Building cost curves for different asset classes
The optimization framework starts by categorizing assets into failure impact groups. A chiller failure stops production. A bathroom exhaust fan failure creates inconvenience. These require very different cost calculations.
Eliminate downtime with proactive maintenance.
Openfixit helps you plan, track, and complete maintenance efficiently—maximizing asset reliability.
- Centralized asset management
- Automated maintenance scheduling
- Inventory and parts tracking
No credit card required
Critical production equipment
Total Cost = (PM Labor × Frequency) + (PM Parts × Frequency) + (Failure Rate × Emergency Cost)
Take a production line conveyor motor. Monthly PM costs $180 labor plus $40 in lubrication and minor parts—$2,640 annually. Extending to quarterly drops PM costs to $880 but increases failure probability from 2% to 15%.
-
Emergency labor
$850
-
Expedited motor
$2,200
-
Production loss (4 hours)
$1,450
The math:
-
Monthly PM total cost
$2,640 + (0.02 × $4,500) = $2,730
-
Quarterly PM total cost
$880 + (0.15 × $4,500) = $1,555
Quarterly wins financially—but only if you can tolerate a 15% failure risk.
Support infrastructure
Total Cost = PM Costs + Failure Costs + Comfort/Compliance Penalties
A rooftop unit serving office space:
-
Monthly service
$1,920/year labor, $480 parts
-
Quarterly service
$640/year labor, $320 parts
-
Semi-annual
$320/year labor, $240 parts
Failure rates and costs:
-
Monthly
3% chance, $1,800 repair
-
Quarterly
8% chance, $2,100 repair
-
Semi-annual
22% chance, $2,400 repair
Once you factor in tenant complaints and potential lease penalties for comfort issues, semi-annual looks a lot less attractive despite the lower base cost.
Utility systems
Compressed air, steam, and electrical distribution need balanced intervals based on redundancy. Systems with backup can stretch intervals. Single points of failure need conservative scheduling. A facility with dual air compressors can push PM intervals 30–40% longer than one running a single unit, since a failure doesn't mean a complete loss of service.
Sample calculations across common assets
Here's how the framework applies to equipment you're probably maintaining right now:
| Asset Type | Traditional Interval | Optimized Interval | Annual Savings | Key Trade-off |
|---|---|---|---|---|
| Centrifugal Chiller | Monthly | 6 weeks | $1,840 | 3% higher failure risk |
| Air Handler Filters | Monthly | By pressure (avg 7 weeks) | $920 | Requires monitoring |
| Elevator | Monthly | 5 weeks | $1,560 | Regulation dependent |
| Cooling Tower | Weekly (summer) | 10 days | $2,080 | Water treatment critical |
| Emergency Generator | Monthly test + quarterly PM | Monthly test + semi-annual PM | $640 | Load bank test quality |
The table above lists common assets, their traditional and optimized intervals, estimated annual savings, and the primary trade-offs to consider.
Running pilot programs without disrupting operations
Testing new intervals requires a careful rollout. Start with non-critical redundant systems where a failure won't cascade into something bigger.
Phase 1: Data gathering (4–6 weeks)
Pick 3–5 similar assets. Track actual PM time, parts used, and any failures between services. Most teams discover their monthly PMs take 35 minutes, not the scheduled hour. That alone changes the calculation.
Document current costs:
-
Direct labor hours including travel time
-
All parts and consumables
-
Any failures and associated repairs
-
Equipment downtime impact
Phase 2: Test extension (8–12 weeks)
Extend intervals by 25–30% on pilot assets. If you're doing monthly, try every five weeks. Track the same metrics plus:
-
Condition at each PM (photos help)
-
Any uptick in minor issues
-
Technician observations on wear patterns
Keep one similar asset on the original schedule as a control. That comparison is what actually tells you whether changes are causing problems or just feel different.
Phase 3: Calculation and decision
After two extended cycles, run the total cost comparison:
-
3 monthly PMs × $180 = $540 labor
-
3 × $45 parts = $135
-
0 failures = $0
-
Total
$675
-
2 PMs × $180 = $360 labor
-
2 × $52 parts = $104 (slightly more wear)
-
0 failures = $0
-
Total
$464
That's $211 saved per asset over 12 weeks, scaling to roughly $900 annually. Across 25 similar assets, you're looking at $22,500 in reduced maintenance costs.
Keep one similar asset on the original schedule as a control for direct comparison.
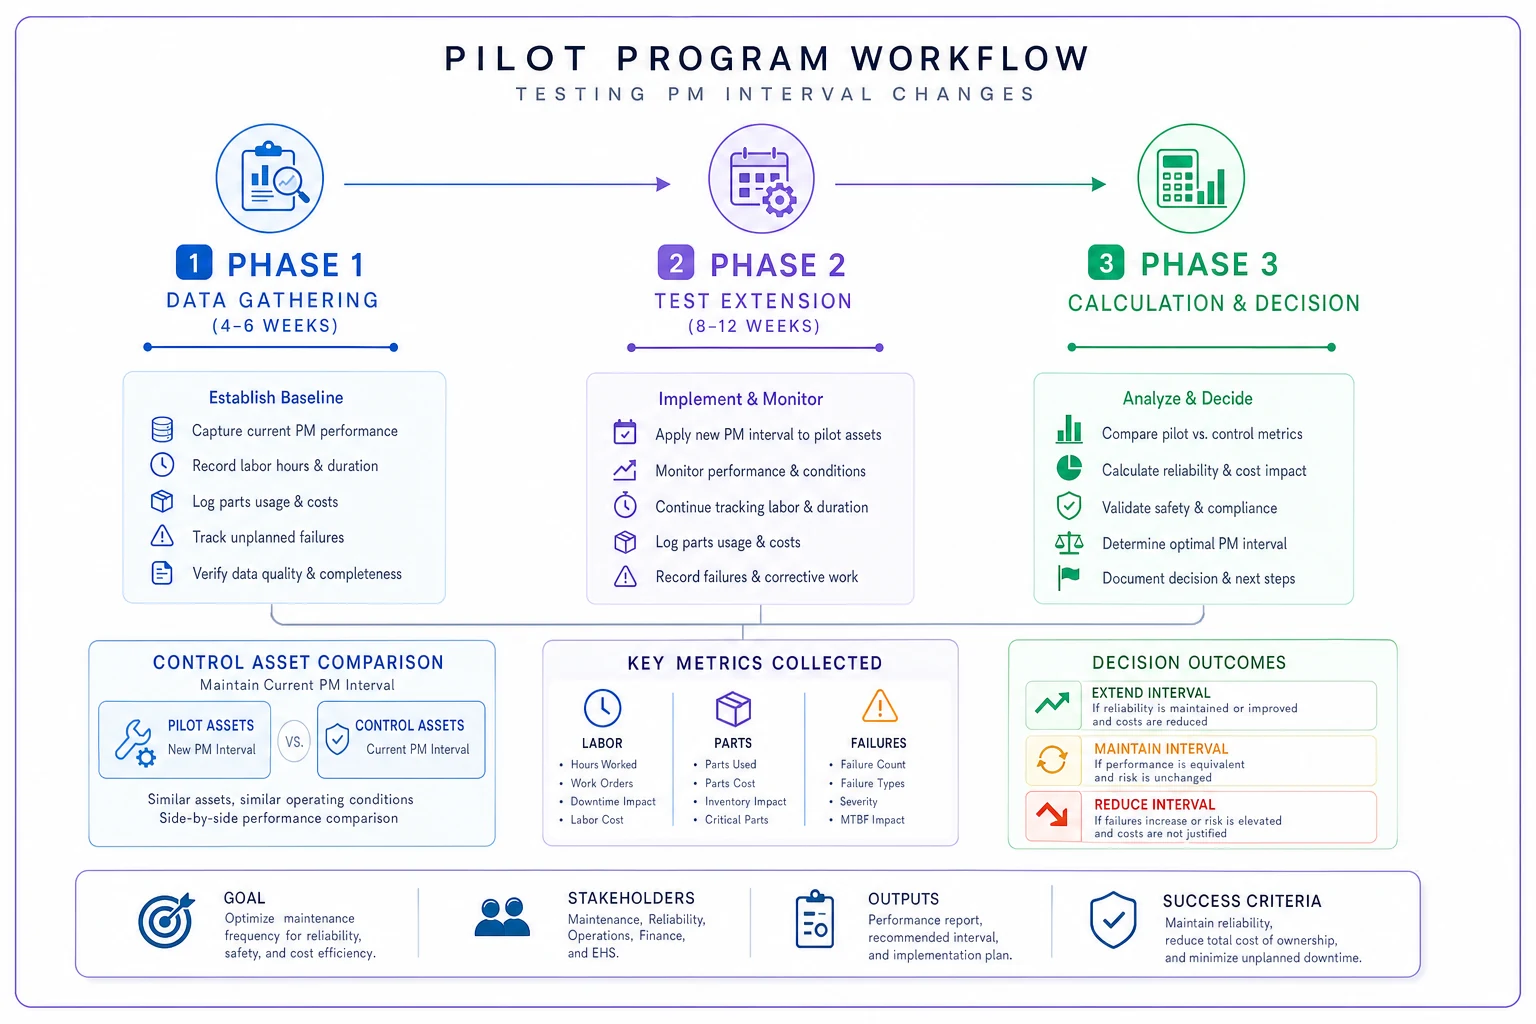
A simple visual of the pilot workflow helps align teams and clarifies data collection points.
Software platforms that calculate optimal intervals automatically
Manual calculation works fine for pilots, but maintaining optimization across hundreds of assets gets unmanageable without systematic tracking. Modern AI-powered maintenance platforms now incorporate failure data, cost inputs, and performance metrics to suggest interval adjustments automatically—without requiring someone to maintain a sprawling spreadsheet.
The real advantage is continuous refinement. As equipment ages, optimal intervals shift. A pump that needed quarterly service in year two might optimize at six-week intervals by year five as wear accelerates. Platforms built around AI automation track these patterns across your entire asset base, flagging when intervals need adjustment based on actual performance data rather than static schedules.
These platforms typically reduce total maintenance costs by 20–30% within the first year through interval optimization alone, while also providing audit trails for compliance-critical equipment where you need to justify deviations from manufacturer recommendations.
Common optimization mistakes that increase costs
Changing everything at once
Facilities that shift all PM schedules simultaneously can't identify what's working versus what's causing problems. When bearing failures spike three months later, you won't know if it was the extended motor PMs, reduced vibration checks, or deferred lubrication.
Ignoring seasonal patterns
Cooling equipment works harder in summer. Extending PM intervals based on winter performance data leads to August failures when load peaks. Same applies to heating systems—boiler intervals that hold up in October might cause January breakdowns during continuous operation.
Focusing only on labor costs
Cutting PM frequency from monthly to quarterly saves $1,800 in labor but might increase parts consumption by $900 if components wear faster between services. Net savings shrinks to $900, and reliability drops.
Missing cascade effects
A dirty condenser coil that gets skipped reduces chiller efficiency by around 8%. The chiller still runs, so no failure gets logged. But energy costs climb $280 a month. After six months, that efficiency loss costs more than the skipped maintenance saved.
Real facility example: Manufacturing plant PM optimization
A metal fabrication facility in Ohio ran everything on calendar-based monthly PMs. 127 assets, four technicians, constant overtime.
Initial assessment revealed:
-
31 assets had no failures in three years of monthly service
-
18 assets failed despite monthly PMs—wrong interval type entirely
-
42 assets were redundant and could safely run longer intervals
They started pilots on dust collectors, which had backup units. Extended from monthly to six-week intervals. After four months:
-
Zero increase in failures
-
32 labor hours saved monthly
-
Freed capacity to focus on more critical equipment
Next, they looked at their five CNC machines with the highest downtime. These were getting monthly PMs but failing quarterly anyway. The problem: monthly was too long for cutting fluid systems but too frequent for mechanical components. Solution was weekly fluid checks paired with quarterly mechanical PMs.
Results after one year:
-
Overtime dropped from 18% to 6%
-
Equipment uptime climbed from 91% to 94%
-
Maintenance costs decreased roughly $67,000
-
Removed 28% of scheduled PM tasks while improving reliability
The key wasn't just stretching intervals—it was matching them to actual failure patterns and operational reality.
Setting up your optimization framework
Start with accurate baseline data. Most facilities don't know their true PM costs because labor gets averaged, parts get estimated, and failures aren't properly attributed to missed maintenance versus normal age-related wear.
Build asset categories based on:
-
Production impact (critical/important/convenience)
-
Redundancy (backup available or single point)
-
Failure cost (including downstream effects)
-
Regulatory requirements (some intervals are non-negotiable)
Calculate current state costs for each category. Include everything: labor, parts, contractors, failures, downtime, overtime, expedited shipping. This becomes your benchmark.
Test interval changes gradually. Document results carefully. What looks like savings might be deferred problems. A bearing that would have been caught at 30 days might catastrophically fail at day 45, taking out the motor coupling and shaft in the process.
The framework succeeds when total costs decrease while reliability stays stable or improves. That balance point varies by asset, facility, and operation. Generic schedules will never find it. Your actual operational data will.
Optimizing PM intervals isn't about doing less maintenance—it's about doing smarter maintenance. Facilities seeing real cost reductions aren't cutting corners. They're eliminating waste while focusing resources where they actually matter.
The math is straightforward once you have solid data: labor cost times frequency, plus parts cost times frequency, plus failure probability times failure cost. Gathering that data, testing carefully, and rolling out changes without disrupting operations—that's where the real work is, and where good frameworks and the right software support make a meaningful difference.
Every facility has assets being over-maintained and others deteriorating between services. Finding and fixing those mismatches through data-driven interval optimization typically delivers the fastest ROI of any maintenance improvement initiative. The only question is whether you'll keep following generic schedules or start calculating what actually works for your operation.
Ready to optimize your maintenance operations?
Join 2,000+ facilities using Openfixit to reduce unplanned outages, extend asset life, and improve operational efficiency.