



Most facilities carry way too much inventory in the wrong places. Think $40k worth of motor bearings gathering dust while you run out of $8 gaskets that shut down production. The disconnect between what maintenance teams stock versus what actually breaks creates this strange situation where you're simultaneously overstocked and understocked.
The standard approach to spare parts ABC analysis gets you halfway there. You categorize parts by annual spend, set different reorder rules, then wonder why you still have cash tied up in dead inventory while critical components run dry. The problem isn't the ABC framework itself—it's that most implementations ignore consumption patterns, lead time variability, and the actual operational cost of stockouts.
What maintenance teams need is a sprint methodology that combines ABC categorization with real consumption data, then systematically adjusts reorder rules based on what happens in your specific facility. Not theoretical optimal stock levels from a textbook—rules that reflect your actual failure patterns, supplier reliability, and operational constraints.
Why traditional ABC analysis breaks down for maintenance parts
The classic ABC split—80% of value from 20% of items—works great for retail or finished goods manufacturing. Maintenance spare parts follow different rules. A $12,000 chiller compressor might sit untouched for three years, while $2 filter cartridges get consumed weekly. Annual spend alone doesn't capture criticality.
A distribution center analyzed last year had an ABC breakdown that looked reasonable on paper:
-
A items
18% of SKUs, 79% of annual spend
-
B items
31% of SKUs, 16% of spend
-
C items
51% of SKUs, 5% of spend
When we mapped actual stockouts to operational impact, the story changed completely. The biggest production disruptions came from C-category items—cheap seals, fuses, fasteners that nobody tracked closely. Meanwhile, they held eighteen months of inventory for expensive A-items that had predictable replacement cycles and reliable suppliers.
The traditional model assumes all stockouts cost the same. In maintenance, a missing $3 o-ring can idle equipment worth $50k per hour of downtime, while being out of a $5,000 spare motor might not matter if you have redundancy or can rent a temporary replacement.
Setting up the mathematical framework (with real calculations)
Here's an expanded ABC framework that actually works for maintenance operations. Instead of pure spend-based categories, you need a weighted scoring system:
Eliminate downtime with proactive maintenance.
Openfixit helps you plan, track, and complete maintenance efficiently—maximizing asset reliability.
- Centralized asset management
- Automated maintenance scheduling
- Inventory and parts tracking
No credit card required
Criticality Score = (Annual Usage Value × 0.3) + (Stockout Cost × 0.4) + (Lead Time Factor × 0.3)
Annual usage value is straightforward—quantity consumed × unit cost over twelve months. Stockout cost requires thinking through cascading impacts. If a bearing failure stops one machine, that might be $500/hour. If it stops an entire line, you're looking at $8,000/hour.
Lead time factor isn't just the supplier's quoted delivery. It's the realistic time from recognizing a need to having the part installed. For a specialized pump seal, that might include:
-
2 days to identify exact specification
-
5 days standard supplier lead time
-
1 day for receiving and inspection
-
0.5 days for scheduling installation
That's 8.5 days total, not the "5-day delivery" the vendor promised.
Here's the math applied to actual parts from a food processing facility:
| Part | Annual Usage | Stockout Cost | Lead Time Factor | Criticality Score |
|---|---|---|---|---|
| Conveyor Belt Module | 24 units × $185 = $4,440 | $2,200/hr × 4 hrs = $8,800 | 3 days = 0.6 (moderate) | (4,440×0.3)+(8,800×0.4)+(0.6×0.3) = 4,858 |
| Motor Starter | 3 units × $890 = $2,670 | $2,200/hr × 8 hrs = $17,600 | 7 days = 0.9 (high) | (2,670×0.3)+(17,600×0.4)+(0.9×0.3) = 8,111 |
Despite lower annual spend, the motor starter ranks higher because of longer downtime impact and lead time. That's exactly the kind of thing that gets missed when you're sorting by spend alone.
The 90-day sprint structure that gets results
A quarter gives you enough time to collect meaningful data without falling into analysis paralysis. Here's the sprint breakdown:
Days 1–30: Baseline and categorize
Pull twelve months of consumption history from your CMMS or inventory system. If you don't have good historical data, that's actually useful information—it means you've been flying blind. For gaps, use technician interviews and work order histories to reconstruct usage patterns.
Calculate criticality scores for every SKU. For a mid-size facility, this typically means 300–800 items, not the thousands you might fear. Many parts haven't moved in years—flag them for review but don't burn time analyzing dead inventory yet.
Sort into categories with these thresholds:
-
A items
Top 15% by criticality score
-
B items
Next 35%
-
C items
Bottom 50%
Most analyses stop here, which is where the problems start. You need subcategories for special situations:
-
A-Critical
Can't substitute, single source
-
A-Flexible
High criticality but alternatives exist
-
C-Consumable
High volume, low individual impact
-
C-Insurance
Rarely used but catastrophic if unavailable
Days 31–60: Implement reorder rules
The standard economic order quantity (EOQ) formula needs real adjustment for maintenance:
Modified EOQ = √[(2 × Annual Demand × Order Cost) / (Holding Cost × (1 + Stockout Risk Factor))]
The stockout risk factor is what makes this work for maintenance. For A-Critical items, use 0.8–1.2. For C-Consumables, use 0–0.2. This biases order quantities toward overstocking critical items while keeping consumables lean.
Reorder points need similar adjustment:
| Category | Service Factor | Availability Target |
|---|---|---|
| A-Critical | 2.5–3.0 | 99.5% |
| A-Flexible | 1.8–2.2 | 95% |
| B items | 1.2–1.6 | 90% |
| C-Consumable | 0.8–1.0 | 80% |
| C-Insurance | Hold 1–2 units regardless | — |
A bearing with 2 units/month demand and a 3-week lead time works out to: lead time demand of 1.5 units, multiplied by the A-Critical service factor of 2.5, gives a reorder point of 3.75—round to 4 units.
Days 61–90: Measure and adjust
Track three metrics weekly:
-
Stockout incidents by category
-
Inventory turns (annualized usage / average inventory)
-
Dead stock accumulation
If A-items stock out, increase safety factors by 20%. If C-items haven't moved in 60 days, cut reorder quantities in half. The adjustments matter more than the initial numbers.
Visualize the 90-day sprint workflow below.
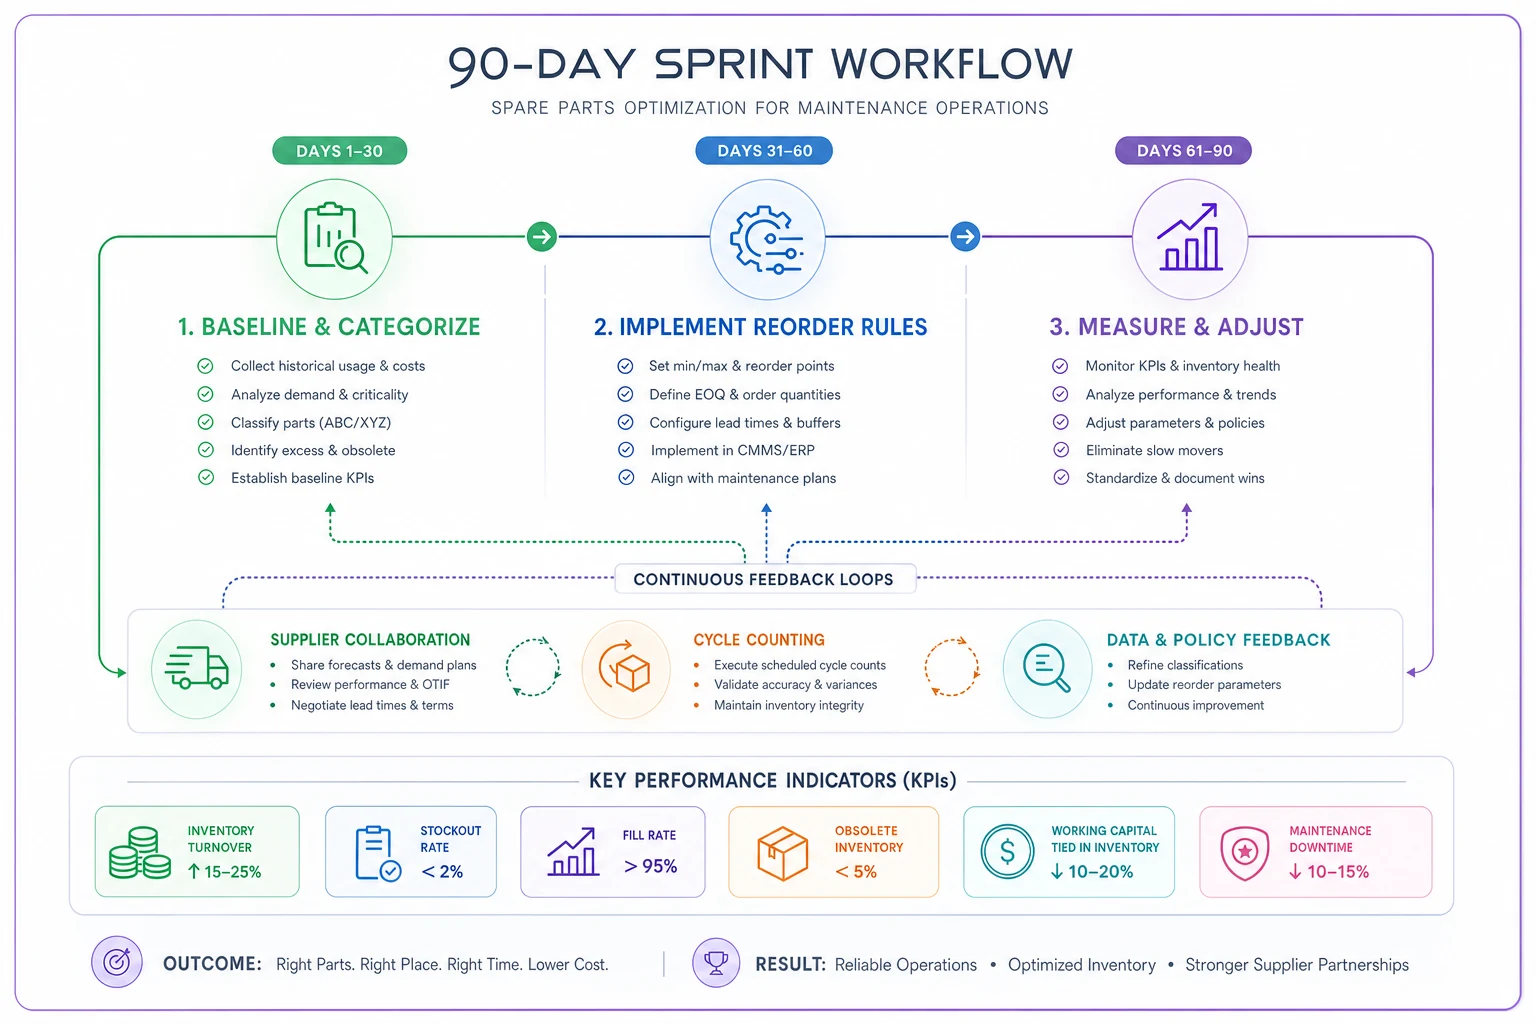
Use the sprint to test adjustments quickly and let real outcomes drive your rule set.
Working with suppliers to optimize the system
Suppliers become critical partners when you're running tighter inventories. The typical vendor relationship—order when needed, complain about delays—won't hold up. You need structured tactics for each ABC category.
For A-items, negotiate consignment or vendor-managed inventory agreements. A chemical plant got their seal supplier to maintain roughly $22k of inventory on-site, only invoicing upon consumption. The supplier agreed because it locked in the contract and gave them usage visibility—it actually worked out for both sides.
Set up blanket purchase orders for B-items with scheduled releases. Instead of processing 50 separate purchase orders for the same motor capacitors, create one annual agreement with monthly deliveries. This reduces transaction costs and often unlocks volume pricing, typically somewhere in the 8–15% range.
C-items need consolidation. Bundle orders across vendors using maintenance supply distributors. A hospital facilities team reduced their order processing time by around 60% by routing all C-items through a single industrial supplier with next-day delivery. They paid slightly more per unit but saved significant procurement overhead.
For critical spares with long lead times, explore supplier stocking agreements. Many vendors will hold inventory if you commit to eventual purchase. One facility got their gear reducer supplier to stock two units with a six-month purchase commitment—eliminating $18k from their own books while keeping coverage.
Real-world adjustments: When the math meets reality
The formulas give you starting points. Every facility has quirks that break the model.
Seasonal patterns wreck standard reorder points. HVAC parts consumption in July looks nothing like February. Adjust safety stocks seasonally or you'll face summer stockouts and winter overstock.
Equipment age changes consumption curves dramatically. A new air handler might use one belt per year. The same unit at eight years old burns through one monthly. Track age-based consumption multipliers:
| Equipment Age | Consumption Multiplier |
|---|---|
| Years 0–3 | Baseline |
| Years 4–6 | 1.5× baseline |
| Years 7–10 | 2.5× baseline |
| Years 10+ | 3× baseline (or seriously consider replacing) |
Multi-site operations need coordination logic. If three facilities within 50 miles each stock the same expensive spare, you're tripling inventory investment. Designate hub locations for A-items and establish transfer protocols. Sites might grumble about 4-hour transfer times until you show them the $85k inventory reduction.
Budget constraints force trade-offs the math doesn't capture. If you can only afford $50k in inventory but the optimization suggests $70k, apply systematic degradation rules:
-
Protect A-Critical items first
-
Reduce B-item safety stocks
-
Eliminate C-Insurance items where rental alternatives exist
-
Accept stockout risk on C-Consumables
If you follow these priorities, you preserve operational coverage while aligning inventory investment with budget realities.
Building the cycle count program that maintains accuracy
All this optimization means nothing if your records don't match reality. Full physical inventories are disruptive and error-prone. ABC-driven cycle counting maintains accuracy without operational chaos.
A-items get counted monthly. With roughly 15% of SKUs in this category, that's about 45–60 items to verify. Split across 20 working days, you're counting 2–3 high-value items daily. Count when issuing or receiving to minimize disruption.
B-items rotate quarterly. Each day, count 5–6 B-category parts. Focus on items with recent activity first—those are most likely to have discrepancies. Variances over 5% warrant immediate investigation. Usually it's unrecorded usage or misplaced stock.
C-items get annual counts unless they show suspicious activity. If a part that typically sits untouched suddenly shows movement, spot-check it. Random sampling of 10% of C-items quarterly helps catch systemic issues without excessive counting burden.
Track accuracy by category and look for patterns. If bearings consistently show variances, technicians might be grabbing them without recording. If consumables are always off, the unit of measure might be wrong—counting boxes versus individual pieces is a more common error than most people expect.
When operational software handles inventory management, cycle count routines can become automated triggers. The system flags discrepancies, suggests count priorities based on transaction patterns, and can identify likely causes of variances by analyzing behavior across similar parts—handling the routine monitoring so your team focuses on decisions that actually require judgment.
Common pitfalls that derail the sprint
The biggest failure point tends to hit around day 40 when reorder rules go live. Purchasing sees increased orders for A-items and panics about budget impact. Prepare them in advance with category-level spending projections that show total inventory investment actually decreases despite higher safety stocks on critical items.
Technician resistance shows up when familiar parts suddenly require approvals or have lower stock levels. Involve senior technicians in the categorization process early. When they help classify parts, they own the outcomes and become advocates instead of obstacles.
Data quality issues surface immediately. You'll find parts with no usage history, duplicate SKUs for identical items, obsolete parts still showing active status. Budget around 20% of sprint time for data cleanup. It's painful, but the alternative is building bad rules on bad data.
Supplier communication gaps create chaos when you suddenly change ordering patterns. A vendor receiving 5× normal volume might assume it's a mistake and delay shipment. Give suppliers a heads-up about the optimization project and expected order changes before you flip the switch.
The "perfect math" trap catches analytical types. They spend weeks fine-tuning formulas while stockouts continue. Eighty percent accurate rules implemented now beat 95% accurate rules delivered six months from now. Start simple and refine based on actual results.
Measuring success: KPIs that matter
Inventory turnover should increase 15–25% as you reduce overstock on slow movers. A facility carrying $180k in parts inventory with $540k annual usage starts at 3× turns. Post-optimization, carrying $150k with the same usage yields 3.6× turns.
Stockout frequency might actually increase initially for C-items as you reduce safety stocks. Track stockouts by category and operational impact. Five C-item stockouts costing 30 minutes each beats one A-item stockout causing four hours of downtime.
Cash released from inventory is usually the most visible win. Most facilities free up somewhere between $30k–$60k in the first sprint by identifying and liquidating obsolete stock while reducing holdings on low-criticality items.
Order processing efficiency improves as standardized rules reduce decision-making time. Measure monthly purchase orders processed and time from requisition to placement. Typical improvements land around 20–30% reduction in processing time.
The real success metric is operational: production uptime. If you maintain or improve equipment availability while reducing inventory investment, the sprint worked. A 0.5% uptime improvement sounds small, but on $10M annual production, that's $50k in recovered value.
Taking it forward: From sprint to steady state
The 90-day sprint establishes baselines and proves the concept. Ongoing optimization needs quarterly reviews:
-
Q1 Review A-item consumption patterns and supplier performance
-
Q2 Analyze B-item categorization—should any move up or down?
-
Q3 Purge obsolete C-items and review insurance spares
-
Q4 Comprehensive reorder rule validation and adjustment
Build institutional knowledge about parts criticality. When technicians understand why certain parts have higher stock levels, they make better field decisions. A motor bearing showing early wear signs triggers proactive ordering when everyone knows it's A-Critical—not because they were told to, but because it makes sense to them.
AI-assisted operational platforms can automate much of the ongoing work once you have the framework in place. They track consumption patterns, flag anomalies, and suggest reorder adjustments based on actual facility performance—handling routine analysis so your team can focus on decisions that require real judgment. They're particularly good at catching edge cases that slip through manual review: gradual shifts in seasonal patterns, part combinations that predict upcoming failures, slow deterioration in supplier reliability.
Your specific starting point
Every facility has different constraints, but the sprint framework adapts. If you're running lean on staff, extend to 120 days but keep the same phases. If budget approval is slow, run the analysis phase first and use projected savings to make the case for implementation.
Start with your highest-pain area. If production screams about stockouts weekly, begin with A-Critical categorization. If finance is pressuring inventory reduction, focus on C-item rationalization first.
Most importantly, don't wait for perfect conditions. The facilities that see real improvements aren't the ones with pristine data and unlimited budgets. They're the ones that started with what they had, measured results honestly, and adjusted based on actual performance rather than theoretical optimization.
The spare parts ABC analysis framework combined with a practical 90-day sprint gives you a proven path to reduce inventory investment while improving availability. The math matters, but execution and continuous refinement make the real difference. Start the sprint, trust the process, and watch spare parts management shift from a constant headache to something that actually works.
Ready to optimize your maintenance operations?
Join 2,000+ facilities using Openfixit to reduce unplanned outages, extend asset life, and improve operational efficiency.