

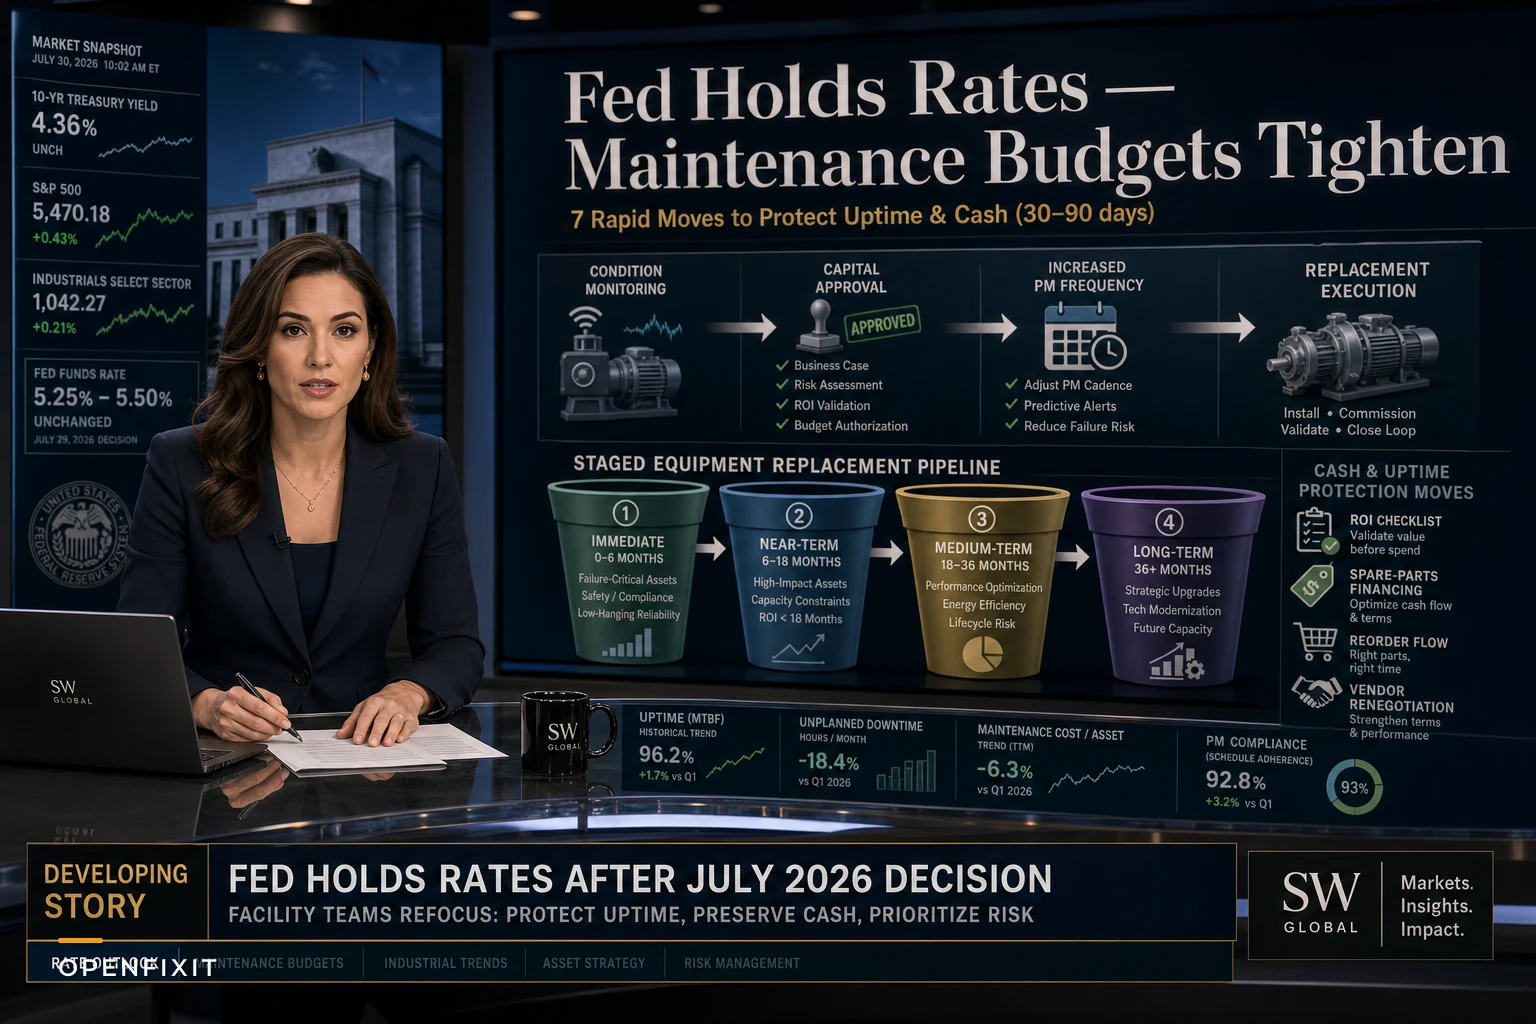

The Fed held rates at 3.50%–3.75% yesterday, but three board members wanted to hike. That divided decision from the CNBC report tells you exactly where maintenance budgets are headed for the rest of 2026: nowhere comfortable.
For facility managers, this hawkish hold means your equipment replacement loan still costs 8–9%, spare parts financing runs around 11%, and that HVAC upgrade you've been pitching to finance? They're now asking for a 15% hurdle rate instead of the 10% you modeled last year. What most facility teams miss about higher rates isn't the capital project stuff—that's obvious. The real damage happens in your operational budget when you start cutting corners on predictive maintenance, stretching PM intervals past manufacturer specs, and running equipment toward failure because "we can't afford the downtime for repairs right now." That's where it gets ugly.
The hidden maintenance budget crisis nobody talks about
Every maintenance manager understands the obvious impact: capital projects get delayed, equipment runs longer, budgets shrink. What's less obvious is how higher interest rates create a cascade of bad decisions that compound over 18–24 months.
Take spare parts inventory. A distribution center in Ohio cut their critical spares budget by 40% when rates first jumped. Seemed like a smart cash preservation move. Six months later, their main air handler bearing failed. The part that normally sits on their shelf? Now it's a $4,800 overnight shipment plus 14 hours of unplanned downtime—$31,000 in lost productivity.
The math gets worse from there. Factor in overtime for eight technicians at time and a half, expedited freight, and secondary damage from running the system in bypass mode—that $1,200 bearing they didn't stock ended up costing $47,000 all-in.
Higher rates don't just make money expensive. They push facility managers into irrational decisions about their maintenance programs. Teams defer $3,000 motor rebuilds, then spend $18,000 on emergency replacements four months later. The pressure to show quarterly cash preservation makes people ignore basic asset lifecycle economics, and it's a pattern that plays out the same way almost every time.
Move 1: Shift from calendar-based to condition-based PM intervals
Most facilities run preventive maintenance on fixed calendars—monthly filter changes, quarterly belt inspections, annual motor servicing. When budgets tighten, the knee-jerk reaction is stretching these intervals. Going from monthly to every six weeks saves roughly 17% on PM labor costs.
Eliminate downtime with proactive maintenance.
Openfixit helps you plan, track, and complete maintenance efficiently—maximizing asset reliability.
- Centralized asset management
- Automated maintenance scheduling
- Inventory and parts tracking
No credit card required
Except that's the wrong metric to optimize. What you should track is failure rate per asset class. When a pharmaceutical facility pushed their air handler PMs from monthly to six weeks, bearing failures jumped from 2 per year to 7. Each failure wiped out the entire year's PM savings in a single incident.
Instead, use condition triggers. Run your HVAC filters to a specific pressure drop reading, not a calendar date. Some filters last 25 days during high-pollen season, others run 45 days in winter. You're spending PM dollars when the equipment actually needs it, not when someone's Outlook reminder fires.
-
Filters
0.5" water column pressure drop (not monthly)
-
Belts
1/4" deflection with 10 lbs force (not quarterly)
-
Motor vibration
0.15 IPS velocity (not annual)
-
Bearing temperature
15°F above baseline (not biannual)
Operational software that tracks these readings can flag assets approaching thresholds before they go critical. You perform maintenance based on actual equipment condition—not arbitrary schedules someone set up five years ago and nobody's questioned since.
Move 2: Create a failure cost multiplier for each asset
Budget committees love cutting maintenance because failures feel hypothetical. "Why spend $8,000 maintaining something that's working fine?"
Build a failure cost multiplier table that shows the true operational hit—not just repair cost, but the full picture. Here's what an actual facility documented:
| Asset | Direct Repair Cost | Downtime Cost/Hour | Typical Duration | Secondary Damage | Total Failure Cost | Multiplier |
|---|---|---|---|---|---|---|
| Main Chiller | $12,000 | $4,200 | 18 hours | $8,000 | $95,600 | 8.0x |
| Loading Dock Door | $2,400 | $800 | 6 hours | $500 | $7,700 | 3.2x |
| Emergency Generator | $4,500 | $0 | 4 hours | $0 | $4,500 | 1.0x |
| Process Compressed Air | $3,200 | $6,100 | 8 hours | $2,200 | $54,200 | 16.9x |
That 16.9x multiplier on compressed air changes the conversation entirely. Suddenly that $3,000 compressor rebuild doesn't look expensive—it looks like insurance against a $54,000 hit. Put that table in front of a CFO and the maintenance budget argument gets a lot easier.
Move 3: Implement staged equipment replacement planning
The worst time to replace equipment is when it fails. The second worst time is when rates are high and you're scrambling for emergency financing. Yet most facilities run equipment until it dies, then figure out the money later.
Build a staged replacement pipeline that spreads capital needs across quarters. Take your critical equipment list and assign each item to one of four buckets:
Immediate (0–6 months): Equipment showing actual failure indicators—high vibration, temperature spikes, efficiency drops below 70% of baseline. These need replacement regardless of rates.
Near-term (6–18 months): Equipment past 80% of useful life but still functional. Start the capital approval process now, even if rates are high. You need the lead time.
Medium-term (18–36 months): Equipment at 60–80% of useful life. Monitor closely, increase PM frequency, start researching replacement options.
Long-term (36+ months): Equipment below 60% of useful life. Standard PM schedule, nothing special needed yet.
A hospital facility in Michigan uses this approach. When rates spiked, they weren't caught off guard—they'd already identified their Immediate bucket (two chillers, one boiler) and secured capital approval before the Fed meeting. Their Near-term bucket got pushed out six months, but they increased PM frequency to buy that time without increasing failure risk.
Below is a simple staged-replacement workflow.
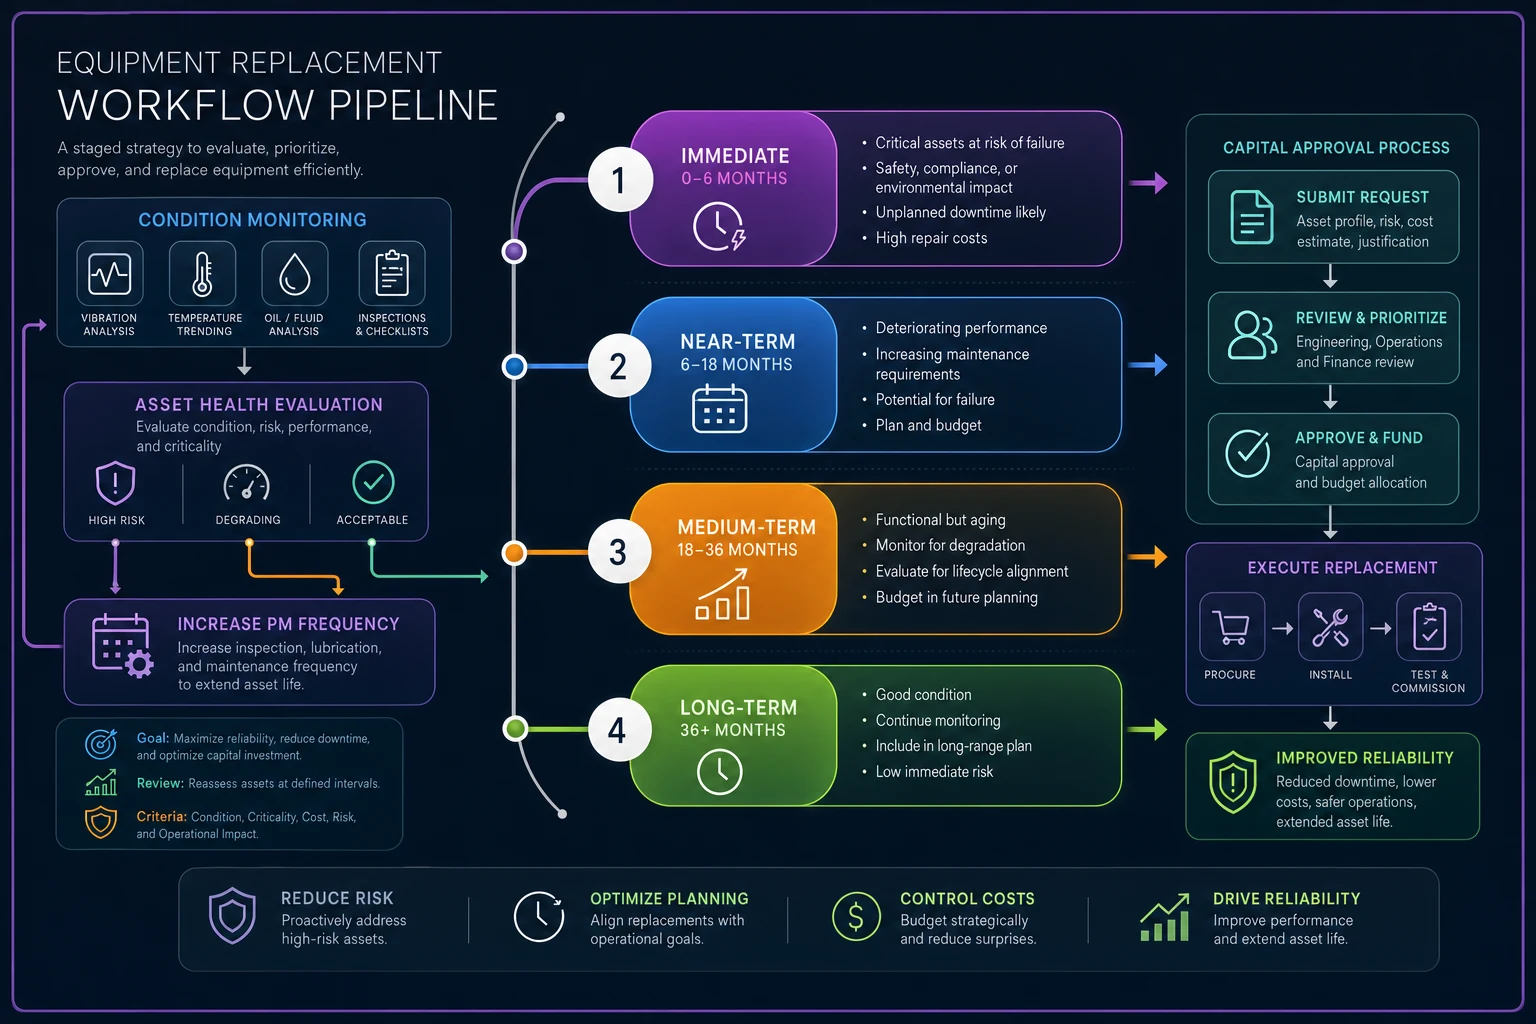
Use this pipeline to schedule replacements across quarters and avoid emergency financing when assets fail.
Move 4: Renegotiate vendor agreements for payment flexibility
Your maintenance vendors are feeling the rate pressure too. Their working capital loans jumped from around 5% to 9%. They need cash flow as badly as you need to preserve it.
That's actually leverage. Vendors will trade margin for predictability. Approach your top five maintenance contractors with a straightforward proposal:
"We'll guarantee you $X monthly in work orders for the next 12 months. In exchange, we want net-60 payment terms and a 5% volume discount."
A corporate campus in Texas restructured five vendor agreements this way. Results:
-
Pushed $340,000 in payables out 30 days (saving roughly $2,800/month in carrying costs)
-
Locked in $180,000 in annual savings through volume commitments
-
Reduced emergency repair rates by 15% because vendors prioritized them for the guaranteed work
The catch: you have to actually commit the volume. Set up standing PMs, scheduled repairs, and predictable work through these vendors. They get steady revenue, you get payment flexibility. If you lowball the volume commitment and don't deliver, you'll burn the relationship and lose the terms.
Move 5: Build a maintenance triage matrix for budget constraints
When money's tight, every maintenance request feels urgent. Treating them all as urgent means your budget is gone by October, with nothing left for actual emergencies in Q4.
A triage matrix plots urgency against cost:
High Urgency + Low Cost (under $1,000): Fix immediately. Filters, belts, bearings—small stuff that causes big problems if ignored.
High Urgency + High Cost (over $10,000): Rent temporary equipment while getting multiple quotes. A temporary chiller at $3,000/month beats rushing into a $180,000 replacement under pressure.
Low Urgency + Low Cost: Bundle into weekly work order batches. Technicians handle these during scheduled rounds, not special trips.
Low Urgency + High Cost: Defer to next budget cycle unless efficiency savings clearly justify immediate action.
The matrix keeps emotion out of the equation. That production manager screaming about his office AC? Low urgency, high cost—he can use a portable unit until it makes financial sense to address it properly.
Move 6: Calculate and track cost-of-waiting metrics
Every deferred maintenance decision has a cost. Not fixing something today means it costs more tomorrow—sometimes a lot more. But without tracking the deterioration rate, it's easy to convince yourself that deferral is the smart move.
-
Roof leaks
grow roughly 3x per year without repair
-
HVAC efficiency
drops ~2% per month once filters exceed pressure limits
-
Motor bearings
failure probability increases around 15% per month after vibration exceeds threshold
-
Concrete cracks
expand 1/8" per freeze-thaw cycle
A retail facility tracked their cost-of-waiting on a roof repair. Fixing a 10 sq ft section in June cost $800. They deferred it. By November, water damage had spread to 40 sq ft of decking, ceiling tiles, and inventory. Total repair: $6,400.
The formula they now use: Cost of Waiting = (Deterioration Rate × Time) × Repair Cost Multiplier If waiting three months turns an $800 repair into $6,400, that's about $1,867/month in hidden costs accumulating on a decision that felt like savings. This is exactly why mapping maintenance budgets to asset lifecycles matters more than arbitrary deferrals.
Move 7: Restructure PM programs around failure prevention ROI
Not all preventive maintenance delivers equal value—but most facilities treat every PM as equally sacred. When budgets get cut, they reduce PM frequency across the board, like giving everyone a 10% pay cut instead of making harder, smarter decisions.
Calculate failure prevention ROI for each PM task: ROI = (Prevented Failure Cost × Failure Probability Reduction) / PM Cost
Quarterly motor alignment: Costs $400, prevents $12,000 bearing failure, reduces failure probability by 60%. ROI = 18:1
Monthly cooling tower chemical testing: Costs $200, prevents $8,000 tube fouling, reduces failure probability by 20%. ROI = 8:1
Weekly parking lot inspection: Costs $50, prevents a $2,000 trip hazard liability, reduces probability by 5%. ROI = 2:1
When they needed to cut PM budget by 20%, they knew exactly where to cut. Parking lot inspections went to monthly. Motor alignments stayed quarterly. They trimmed costs without touching the maintenance tasks that actually keep the facility running.
The path forward when rates stay elevated
The Fed's split decision signals extended rate uncertainty. Your maintenance budget isn't getting relief from cheaper capital anytime soon.
The facilities that try to muscle through with arbitrary budget cuts end up calling emergency contractors at 2 AM, expediting parts, and explaining to executives why a $2,000 deferred repair caused $50,000 in downtime. That conversation is a lot harder than defending a maintenance budget in a quarterly review.
Your equipment doesn't care about interest rates. It runs on its own schedule, and it will fail without proper maintenance regardless of what the Fed does.
Build these seven moves into your maintenance operations now. Start with the failure cost multiplier table this week—it's the fastest way to change the internal conversation about maintenance spending. Get vendors on board with payment restructuring before August. Implement condition-based PMs before September heat stress hits your HVAC systems.
Ready to optimize your maintenance operations?
Join 2,000+ facilities using Openfixit to reduce unplanned outages, extend asset life, and improve operational efficiency.