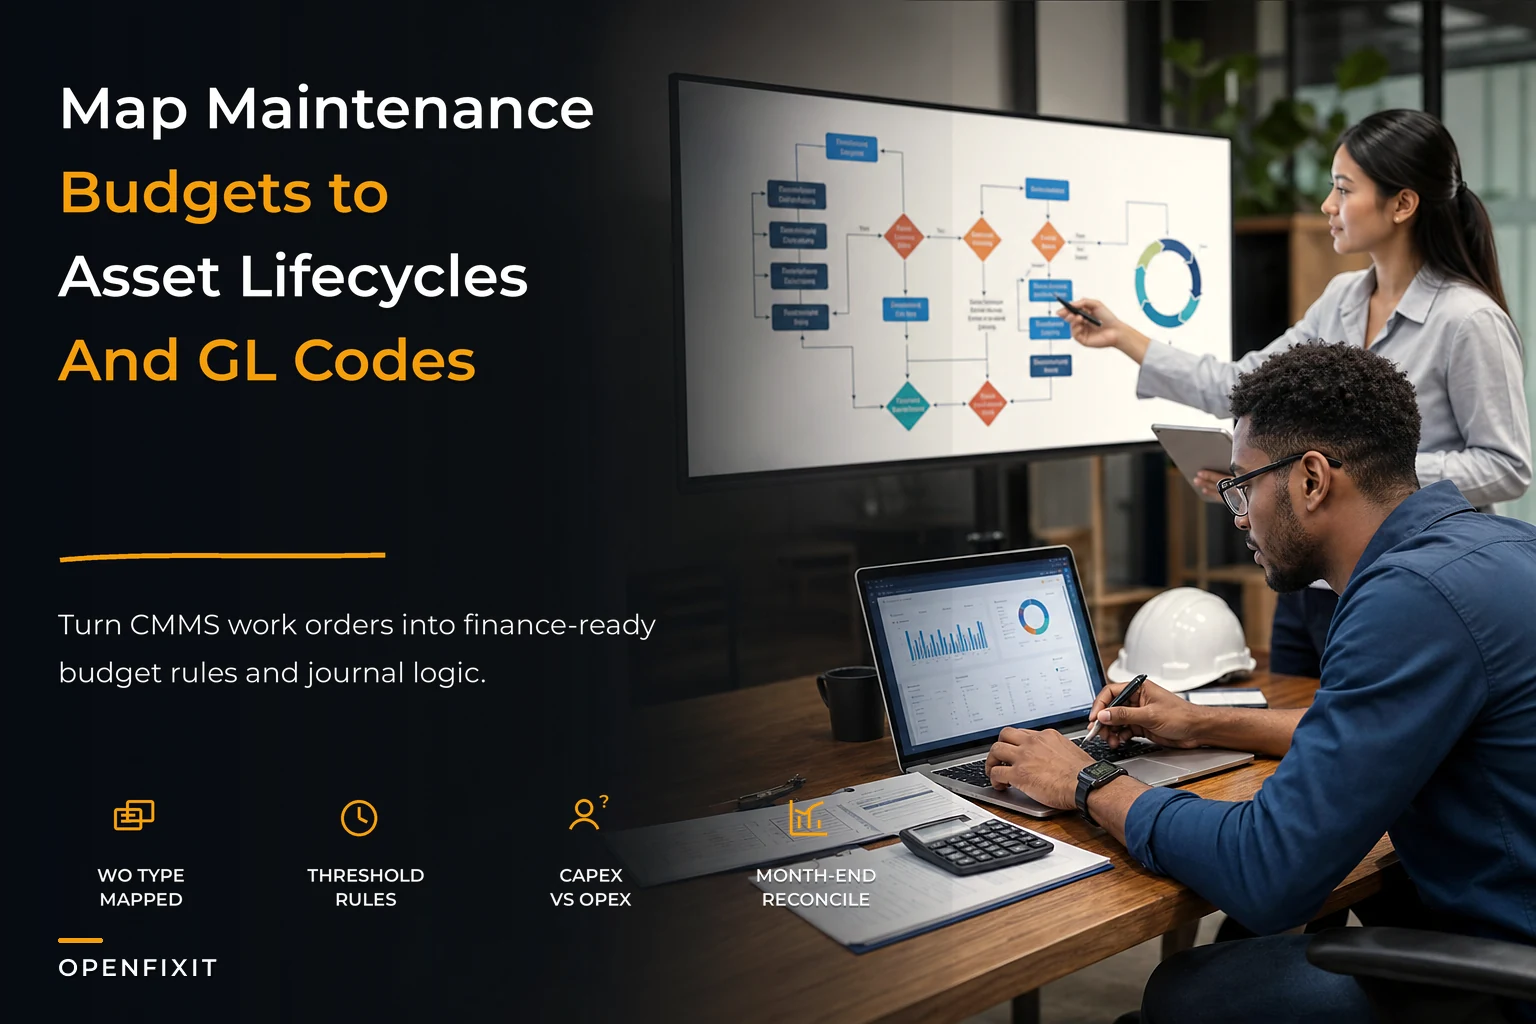

Most facility managers run their maintenance departments like operational islands, completely disconnected from the financial reality that governs every capital decision above them. You track work orders in your CMMS, finance tracks costs in their ERP, and when budget season rolls around, you're scrambling to justify why replacing that chiller costs $85,000 but somehow fixing it for the fourth time this year only costs $12,000.
The maintenance budgeting lifecycle isn't just about tracking costs—it's about speaking finance's language while defending operational decisions that keep facilities running. The pattern is painfully consistent: maintenance speaks in work orders and asset health, finance speaks in depreciation schedules and capital allocation, and nobody has a translation layer between them.
Why maintenance and finance operate in parallel universes
Walk into any facility with more than 200 assets and you'll find the same disconnect. The maintenance team runs everything through their CMMS—emergency repairs, preventive maintenance, predictive work, all of it gets a work order. Meanwhile, finance has their chart of accounts with rigid categories that determine whether something hits the P&L immediately or gets capitalized over seven years.
The problem multiplies when you realize most CMMS platforms weren't built with accounting in mind. They'll track labor hours, parts used, and completion rates, but ask them which work orders should be coded to account 6420-Repairs vs 1580-Capital Improvements, and you get blank stares. Maintenance creates work orders without financial context, finance processes invoices without operational understanding, and both sides wonder why the maintenance budget is always wrong.
What really breaks this system is the capex versus opex decision. A $15,000 compressor replacement might qualify as capital if it extends asset life by five years, but the same $15,000 spent across twelve service calls stays operational. The tax implications alone can swing by thousands of dollars, yet most maintenance teams make these calls based on gut feeling rather than documented criteria.
The downstream effects compound quickly. Without proper coding alignment, you can't track true asset lifecycle costs. That HVAC unit showing $3,000 in annual maintenance might actually be costing $8,500 when you include capital improvements that got miscoded. Your replacement planning becomes guesswork, capital forecasts miss by 30-40%, and executive leadership starts questioning every maintenance budget request because the numbers never match reality.
Mapping CMMS work order types to accounting codes that finance actually uses
The foundation of any maintenance budgeting lifecycle starts with building a bridge between how maintenance categorizes work and how finance tracks spending. This isn't about forcing maintenance to think like accountants—it's about creating systematic connections that work for both sides.
Eliminate downtime with proactive maintenance.
Openfixit helps you plan, track, and complete maintenance efficiently—maximizing asset reliability.
- Centralized asset management
- Automated maintenance scheduling
- Inventory and parts tracking
No credit card required
Start with your existing CMMS work order types. Most facilities run something like this:
-
Emergency/Corrective
-
Preventive Maintenance
-
Predictive Maintenance
-
Capital Projects
-
Minor Modifications
-
Inspections/Compliance
Now look at your accounting structure. A typical mid-sized facility might have:
-
6420
Repairs & Maintenance - Operating
-
6425
Contract Services
-
6430
Preventive Maintenance Program
-
1580
Capital Equipment Purchases
-
1585
Building Improvements
-
6440
Compliance & Regulatory
The mapping isn't one-to-one, and that's where most attempts fall apart. Emergency work might hit 6420 for small repairs but jump to 1580 if you're replacing major components. The key is building decision trees that maintenance techs can actually follow.
| CMMS Work Type | Primary Account Code | Secondary Conditions | Alternative Code |
|---|---|---|---|
| Emergency/Corrective | 6420-Repairs | If >$10K and extends life >1yr | 1580-Capital |
| Preventive Maintenance | 6430-PM Program | If includes major component | 1585-Improvements |
| Predictive Maintenance | 6430-PM Program | If requires consultant | 6425-Contract Services |
| Capital Projects | 1580-Capital | If <$5K total project | 6420-Repairs |
| Inspections | 6440-Compliance | If results in immediate repair | 6420-Repairs |
What makes this actually work in practice is building trigger questions into your work order creation process. When a tech enters an emergency repair, the system should ask: "Is this restoring original function or adding capability?" When they close out the work order, it should prompt: "Did total cost including labor exceed $10,000?" These simple gates prevent the majority of miscoding before it happens.
The real test comes during month-end reconciliation. If maintenance coded 47 work orders to capital accounts but finance only approved 31, you have a calibration problem. Track those variances monthly and adjust your decision rules. After about three months, you should see 85-90% alignment between initial coding and final financial classification.
Use this decision-tree workflow to guide coding and reconciliation.
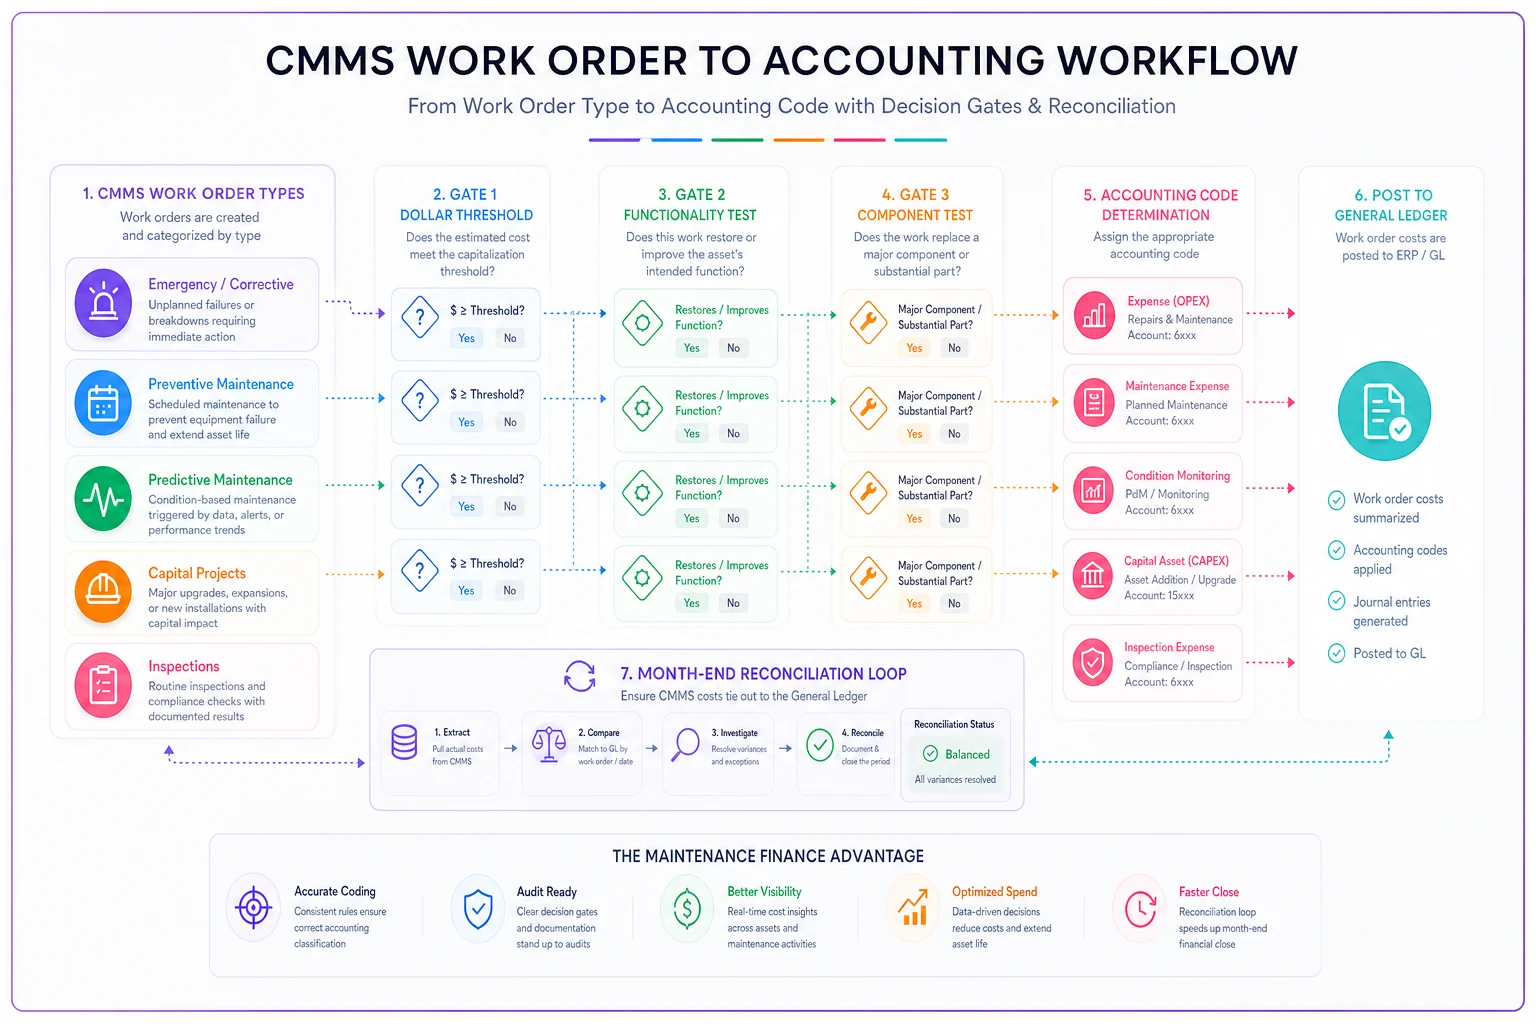
This flow clarifies initial coding, gating decisions, and the reconciliation loop between CMMS and finance.
Building executive budget justifications that actually get approved
Every maintenance manager has sat through the budget meeting where they asked for $240,000 in capital improvements and walked out with $95,000 and a lecture about "doing more with less." The problem usually isn't that executives don't understand maintenance—it's that maintenance doesn't present budgets in executive language.
The one-page justification format consistently outperforms long presentations. Forget the 47-slide deck about asset reliability theory. Executives care about three things: risk mitigation, ROI, and strategic alignment.
Structure your one-pager like this:
Current State (2-3 sentences): Our 15-year-old chiller system has exceeded its design life by 3 years, requiring $47,000 in repairs over the past 18 months with declining reliability metrics showing 73% availability versus our 95% target.
Financial Impact: Continue current path: $35,000 annual repair costs plus $12,000 in production losses from unexpected downtime. Replacement investment: $125,000 with a projected 12-year life, reducing annual costs to $8,000 maintenance plus $10,400 depreciation.
Risk Assessment: 40% probability of catastrophic failure within 12 months based on vibration trends and refrigerant leak frequency. Failure during peak season would cost $180,000 in emergency replacement plus temporary cooling.
Recommendation: Replace during Q4 scheduled shutdown. NPV of replacement versus continued repairs: positive $67,000 over 5 years.
Notice what's missing? Technical specifications, maintenance history details, vendor comparisons. Save those for the appendix. The executive summary needs to tell a financial story with operational consequences, not an operational story with financial implications. It's a subtle shift that changes approval rates significantly.
Credibility comes from your track record. Every justification should reference previous approvals and actual outcomes. "Last year's compressor replacement has delivered $23,000 in energy savings versus the $19,000 projected" builds trust for this year's requests.
Defendable capex vs opex rules that survive audit scrutiny
The capex versus opex decision isn't just an accounting exercise—it affects taxes, cash flow, and compliance. Get it wrong and you're explaining to auditors why you expensed a $30,000 motor replacement or capitalized $8,000 worth of routine maintenance.
The Three-Gate Test
Every maintenance decision flows through three gates:
Gate 1: Dollar Threshold Below $5,000 total cost (parts + labor + overhead): Automatically operational expense Above $25,000: Automatically reviewed for capitalization Between $5,000-$25,000: Proceed to Gate 2
Gate 2: Functionality Test
-
Restore only
Operational expense
-
Adds capability, efficiency, or capacity
Proceed to Gate 3
-
Extends useful life by >20% of original
Proceed to Gate 3
Gate 3: Component Test
-
Is this replacing a major component (>20% of asset value)?
-
Yes, and asset has >2 years remaining useful life
Capital
-
Yes, but asset nearing end of life
Operational
-
No, regardless of other factors
Operational
These gates handle 90% of decisions cleanly. But the real value comes from documenting the edge cases as they come up.
Real scenario: How a 400-bed hospital fixed their $280K budget variance
A regional medical center came to us with a serious problem: their maintenance budget showed $1.8M in spending, but finance showed $2.08M, and nobody could explain the $280,000 gap. The maintenance director was convinced finance was adding costs from other departments. Finance was certain maintenance was hiding expenses. Both were wrong.
The investigation uncovered three fundamental breakdowns in their maintenance budgeting lifecycle. First, their CMMS had 47 different work order types, but finance only had 12 account codes for all facility expenses. Maintenance techs were guessing which code to use, and roughly 30% of work orders had no financial coding at all.
Second, their capex threshold was set at $10,000, but nobody had documented what actually qualified as "capital improvement" versus "repair." The same HVAC compressor replacement got coded three different ways depending on which tech entered the work order.
Third, there was no process for reconciling CMMS data with financial data. Maintenance tracked by work order, finance tracked by invoice, and purchase orders sometimes covered multiple work orders—or a single work order got split across multiple invoices.
The fix took four months:
Month 1: Mapped all 47 work order types to specific account codes with clear decision criteria. Built a two-question flow chart that techs could follow without needing to know accounting rules.
Month 2: Established the three-gate test for capex/opex decisions and trained all supervisors on documentation requirements. Created a simple form attached to any work order over $5,000.
Month 3: Implemented monthly reconciliation between CMMS and finance. Every variance over $1,000 got investigated and corrected. Built a dashboard showing coding accuracy by technician and work type.
Month 4: Refined based on actual usage. Reduced work order types from 47 to 18, simplified the coding matrix, and automated the most common decisions.
Results after six months:
-
Budget variance dropped from $280,000 to under $15,000
-
Coding accuracy improved from 70% to 94%
-
Capital planning accuracy increased from 65% to 89%
-
Audit findings decreased from 17 to 2
The maintenance director kept their job, finance stopped flagging maintenance overspending, and executives finally had budgets they could trust. But the bigger operational win was cleaner asset cost data—which made replacement decisions measurably better.
Templates and tools that actually work in production
Building these systems from scratch wastes months. These templates work across industries, from manufacturing plants to university campuses.
The CMMS-to-Accounting Mapping Matrix
Emergency Repair (<$5K) → 6420-Operating Repairs Emergency Repair (>$5K, restore only) → 6420-Operating Repairs Emergency Repair (>$5K, improvement) → 1580-Capital Equipment Preventive Maintenance (routine) → 6430-PM Program Preventive Maintenance (major service) → Review for Capital Predictive Maintenance → 6430-PM Program Capital Project (planned) → 1580-Capital Equipment Modification/Upgrade → 1585-Building Improvements Compliance/Inspection → 6440-Regulatory
Monthly Reconciliation Checklist
-
Export all closed work orders from CMMS
-
Export all maintenance-related transactions from accounting
-
Match work orders to invoices/POs (target 95% match rate)
-
Review all variances over $1,000
-
Identify miscoded items and correct in both systems
-
Document coding decisions for variances
-
Update decision rules based on patterns
-
Generate variance report for leadership
Capex Decision Documentation Form
For any potential capital expense, document:
-
Asset ID and current age/condition
-
Total estimated cost (parts/labor/overhead)
-
Current functionality vs. post-work functionality
-
Expected life extension (with justification)
-
Three-gate test results
-
Final classification and reasoning
-
Approver name and date
This documentation saves you during audits. When someone questions why a $12,000 pump replacement was capitalized, you have clear reasoning documented at the time of decision—not something reconstructed six months later.
Making the lifecycle connection between maintenance and money
The maintenance budgeting lifecycle isn't really about budgets in isolation. It's about understanding how maintenance decisions flow through financial systems and impact business operations. Every work order has financial DNA that determines how it affects cash flow, taxes, and asset valuations.
Most facilities treat maintenance budgeting as an annual wrestling match with spreadsheets. When every work order carries proper financial coding, when capex decisions follow documented rules, when preventive maintenance intervals align with financial planning, the budget builds itself over time.
The transformation happens gradually. First month, you're just trying to code work orders correctly. By month six, you're forecasting capital needs based on asset deterioration curves. Year two, you're optimizing replacement timing to balance tax advantages against operational risk.
This approach scales with your operation. A 50-asset facility might manage with manual templates and monthly reviews. A 500-asset operation needs workflow automation to handle the volume—AI-powered operational platforms can handle the routine coding decisions automatically, flag exceptions for human review, and generate reconciliation reports without anyone pulling data manually. The principles stay the same either way: clear mapping between operational work and financial tracking, documented decision criteria, and regular reconciliation.
When asset hierarchies and naming conventions are standardized, this financial integration gets significantly more useful. You can track costs not just by individual asset but by system and location, identifying which building systems consistently exceed budget and actually understanding why.
Building your implementation roadmap
Don't try to fix everything at once. Start with your highest-cost assets or most problematic budget categories. Get one department or building working smoothly before expanding.
Phase 1 (Months 1-2): Map existing work order types to accounting codes. Start coding new work orders properly. Don't worry about historical data yet.
Phase 2 (Months 3-4): Implement capex/opex decision rules. Train supervisors on documentation requirements. Begin monthly reconciliation.
Phase 3 (Months 5-6): Refine based on actual usage. Automate common decisions. Expand to additional departments or facilities.
Phase 4 (Ongoing): Monitor accuracy metrics. Adjust rules based on audit findings. Build historical data for better forecasting.
The payoff comes during your next budget cycle. Instead of defending numbers that nobody fully trusts, you're presenting data-backed requests built on months of accurate coding. When maintenance work aligns with broader operational goals, executives start seeing maintenance as an investment rather than a cost center that always seems to run over.
An 85% accurate system that people actually use beats a theoretically perfect system that sits in a binder. Start simple, track what works, and refine based on real-world results. The facilities that manage this well aren't doing anything exotic—they've just built translation layers that let maintenance and finance each do what they do best, while staying aligned on the metrics that actually matter.
Ready to optimize your maintenance operations?
Join 2,000+ facilities using Openfixit to reduce unplanned outages, extend asset life, and improve operational efficiency.