


The dangerous moment in any CMMS or sensor rollout isn't the install. It's the handoff — when the integrator says "we're live," someone signs off, and everybody moves on assuming the data flowing into work orders and dashboards is correct. Then three weeks later a technician notices a chiller alarm never triggered a work order, and now you're doing archaeology on timestamps.
Most teams skip verification because it feels like the integrator's job. It isn't. The integrator confirms the pipe exists. You have to confirm the right water is coming through it, at the right time, in the right units. Those are completely different tests, and the second one is the one nobody runs.
What actually breaks in the first month
The failures after a "successful" go-live almost never look like total outages. If nothing worked at all, you'd catch it day one. The problems are quieter and much more expensive:
-
Sensor values land in the database with wrong units — Fahrenheit stored as Celsius, PSI stored as kPa — so thresholds fire late or never.
-
Timestamps come in as UTC while the CMMS displays local time, so a 2
00 AM vibration spike shows up on the 8:00 AM report as if it happened during the shift.
-
The data "arrives," but it's 40 minutes stale because a polling job runs every half hour instead of streaming, and nobody agreed on acceptable latency.
-
Duplicate asset mappings where two sensors both write to
AHU-3, one silently overwriting the other. -
Null handling — a dropped reading gets stored as
0instead ofnull, and your averages are quietly poisoned.
A typical example: a mid-size distribution center integrated cold-storage temperature sensors into their CMMS to auto-generate work orders when a room drifted above 40°F. The integration passed every "is data flowing?" check. What nobody caught was that the sensor gateway reported in Celsius and the mapping assumed Fahrenheit. So the CMMS saw "4°C" as "4°F" — a value so low it never alarmed. The gap surfaced only when a manual round found a room sitting at 46°F for most of a weekend. No alert, no work order, roughly $8k–$11k in product at risk.
The verification runs in three layers
Think of it as three passes, each answering a different question. Don't collapse them — a system can pass one and fail the next.
Eliminate downtime with proactive maintenance.
Openfixit helps you plan, track, and complete maintenance efficiently—maximizing asset reliability.
- Centralized asset management
- Automated maintenance scheduling
- Inventory and parts tracking
No credit card required
| Layer | Question it answers | What you're actually testing |
|---|---|---|
| Structural | Is the data landing in the right place? | Asset mapping, no duplicates, no orphaned records |
| Semantic | Does the data mean what we think? | Units, timestamp zone, null vs zero, value ranges |
| Temporal | Is the data fresh enough to act on? | End-to-end latency, polling gaps, ingest lag |
The structural layer is what integrators usually test. The semantic and temporal layers are where money leaks. Budget most of your verification time there.
Here's a quick visual of the three-layer verification workflow.
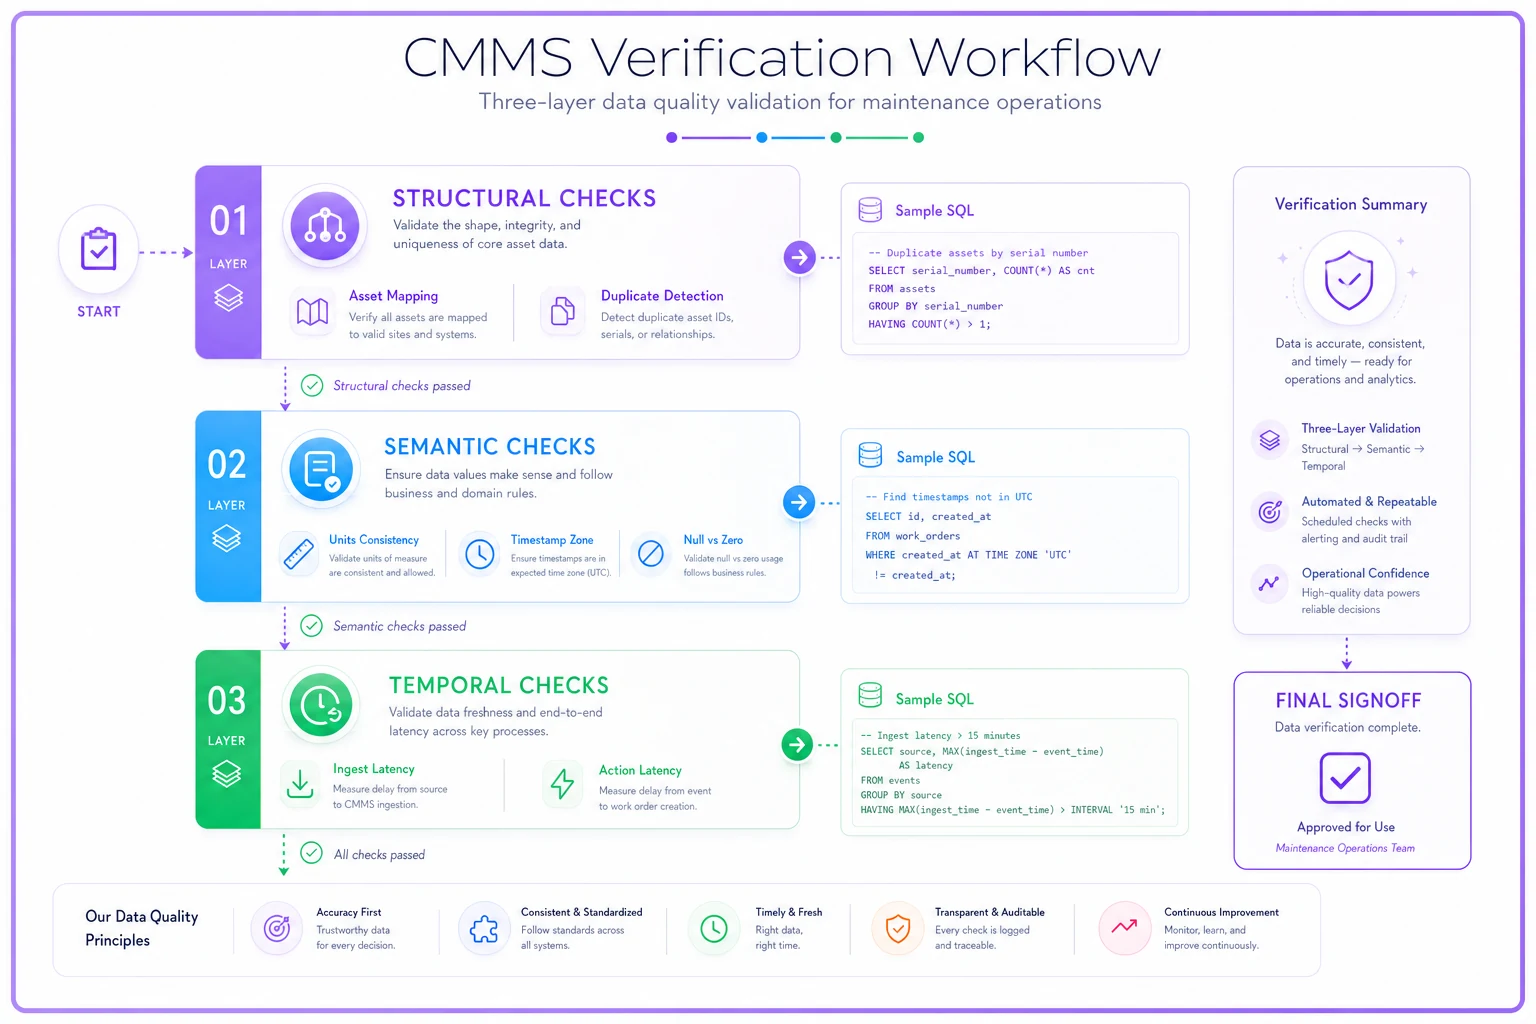
Use the visual to orient the team on which pass to run first and which stakeholders own each layer.
Layer 1: Structural checks
Start by confirming every asset you expect to be reporting is actually reporting, and nothing extra is.
Run a count of distinct asset IDs writing readings in the last 24 hours and compare it against your intended sensor list:
``sql
SELECT assetid, COUNT(*) AS readingcount
FROM sensorreadings
WHERE readingts >= NOW() - INTERVAL '24 hours'
GROUP BY assetid
ORDER BY readingcount DESC;
``
Two things to look for. Any asset ID that shows up here but isn't on your commissioning list — that's an orphaned or mis-tagged sensor. Any asset on your list that's missing from the results — that's a sensor that quietly isn't reporting.
Then check for the duplicate-mapping problem, where two physical sensors write to the same logical asset:
``sql
SELECT assetid, sourcedeviceid, COUNT() AS readings
FROM sensorreadings
WHERE readingts >= NOW() - INTERVAL '6 hours'
GROUP BY assetid, sourcedeviceid
HAVING COUNT() > 0
ORDER BY asset_id;
``
If a single assetid shows two different sourcedevice_id values, you've got a collision. One device is silently overwriting the other, and whichever wrote last "wins." This happens specifically on AHUs and pump pairs where naming gets copied during setup and never corrected.
Layer 2: Semantic checks — the ones people skip
This is where the cold-storage failure lived. A value can be structurally perfect and completely meaningless.
Unit and range sanity. For every sensor type, you know the physically plausible range. A room temperature of 4 is suspicious if you expected Fahrenheit. Run a range check per sensor type:
``sql
SELECT sensortype,
MIN(value) AS minval,
MAX(value) AS maxval,
AVG(value) AS avgval
FROM sensorreadings
WHERE readingts >= NOW() - INTERVAL '24 hours'
GROUP BY sensor_type;
``
Then eyeball it against reality. Cold-storage temps averaging 3.8 means Celsius, not Fahrenheit. Compressor discharge pressure averaging 700 when you expected ~100 means kPa vs PSI. Vibration readings that never exceed 1 when your baseline should be in the 2–5 mm/s range means a scaling factor got dropped somewhere.
Timestamp zone check. This one bites almost everyone. Pull the ten most recent readings and compare the stored timestamp to a known event you can verify — like a sensor you physically triggered two minutes ago.
``sql
SELECT assetid, value, readingts, ingestedts
FROM sensorreadings
ORDER BY ingested_ts DESC
LIMIT 10;
``
If you tapped a door contact at 2:14 PM local and the reading_ts says 19:14, you're storing UTC. That's fine — as long as the CMMS display layer knows that. The failure mode is a mismatch: data stored in UTC, displayed as if it were local, so every report is off by your offset. Confirm the display, not just the storage.
Null vs zero. Force a dropped reading — unplug a sensor for a poll cycle if you safely can — and check what lands. If the gap stores as 0, your averages and threshold logic are corrupted. It should be null or an explicit "no data" marker.
Structural tests confirm the plumbing. Semantic tests confirm the meaning. Most bad integrations pass the first and quietly fail the second for weeks.
Layer 3: The latency test that actually matters
"Real-time" is a marketing word. What you care about is: from the moment a physical event happens, how long until it's actionable in the CMMS? That's end-to-end latency, and it's the number that determines whether a threshold alarm is useful or decorative.
-
Pick one accessible sensor and note the exact wall-clock time you're going to trigger it.
-
Trigger a clear, unambiguous change — open a freezer door, heat a temp probe with your hand, spin a monitored motor.
-
Watch the raw ingest table (not the dashboard) and record the
ingested_tsof the first reading reflecting the change. -
Then watch the CMMS work-order or alert layer and record when the corresponding alert or record appears.
-
Compute two numbers
ingest latency (event → database) and action latency (event → CMMS alert).
The gap between those two numbers is where most surprises hide. Ingest can be five seconds while action latency is 30 minutes because a rule-evaluation job runs on a slow schedule. If your SOP says "alert within 5 minutes of a threshold breach," you just proved whether that's actually true.
Compare what you measure against what you agreed to accept:
| Data type | Reasonable action latency | Red flag |
|---|---|---|
| Safety / life-safety alarms | Seconds to ~1 min | Anything over 2 min |
| Cold-storage / process temps | Under ~5 min | Polling gaps over 15 min |
| Vibration / condition trends | 15–60 min acceptable | Silent gaps with no null markers |
| Meter / consumption readings | Hourly is often fine | Missing hours not flagged |
Also test for gaps, not just delay. A sensor that reports fine most of the time but drops out for 20-minute stretches is arguably worse than a slow one, because the gap is invisible. Query for time buckets with zero readings:
``sql
SELECT datetrunc('minute', readingts) AS minutebucket,
COUNT(*) AS readings
FROM sensorreadings
WHERE assetid = 'CHILLER-1'
AND readingts >= NOW() - INTERVAL '4 hours'
GROUP BY minutebucket
ORDER BY minutebucket;
``
Scan for missing minutes. Regular gaps mean your polling interval is longer than you think, or the gateway is dropping frames.
Automate the checks so you're not doing this by hand every time
Running these queries manually is fine for a single go-live. Rolling out sensors across multiple sites is a different story — you want validation running on its own and flagging anything out of bounds, otherwise the checks quietly stop happening after the second or third install.
-
Compare the reporting asset list against the expected commissioning list and flag missing or unexpected IDs.
-
Check each sensor type's values against a configured plausible range and flag out-of-range averages.
-
Verify the latest
ingested_tsis within your latency threshold per sensor type. -
Detect null-vs-zero handling by flagging suspiciously round zeros in temperature and pressure streams.
-
Scan for reporting gaps larger than the expected polling interval.
A lightweight validation script wraps the same logic and returns a simple pass/fail per rule. In plain terms, it should:
Schedule the validation to run immediately after handoff so drift is caught before it replicates across sites.
This is the kind of repetitive, error-prone checking that AI-assisted operational platforms handle well — a validation routine that runs after every install, watches for units and latency drifting out of spec, and surfaces a short exception list instead of making a human eyeball a hundred queries. The point isn't to remove the engineer; it's to make sure the check actually runs every single time rather than getting skipped under deadline pressure. Modern CMMS platforms with built-in data-quality monitoring can run these validations on a schedule and alert you when a stream goes stale or a value drifts outside its configured band.
The go/no‑go signoff
Verification without a signoff is just a nice email nobody reads. The template below forces a named person to accept the risk, in writing, before the system is trusted for decisions.
Post-install verification signoff
-
[ ] All expected assets reporting; no orphaned or duplicate IDs (Layer 1)
-
[ ] Sensor value ranges match expected units for every type (Layer 2)
-
[ ] Timestamp zone confirmed at both storage and display layers (Layer 2)
-
[ ] Dropped readings store as null, not zero (Layer 2)
-
[ ] Measured action latency within agreed threshold per data type (Layer 3)
-
[ ] No unexplained reporting gaps over the polling interval (Layer 3)
-
[ ] Automated validation script scheduled and alerting configured
-
[ ] Rollback plan documented if a stream is later found bad
Decision: GO / CONDITIONAL GO / NO‑GO Conditional items and owner: _ Signed: Date: _
A conditional go is legitimate and underused. Maybe latency is acceptable for temps but the vibration stream still has gaps. You can go live on temps, hold vibration alarms in "monitor only," and give the gap a named owner and a date. What you can't do is call the whole thing "live" and let the shaky stream drive work orders.
When to run the full SOP — and when not to
The full three-layer run makes sense any time a sensor stream is going to trigger action automatically: auto-generated work orders, threshold alarms, anything that skips a human review step. If someone is going to eyeball every reading anyway, you can lighten the temporal checks.
It's probably overkill for a display-only dashboard nobody makes decisions from — though those have a way of quietly becoming decision-making tools, so run the semantic checks at least once.
Who should not skip this: anyone integrating life-safety or cold-chain sensors, and anyone rolling out the same sensor type across multiple sites. In multi-site rollouts the failure replicates — one bad unit-mapping template gets copied to every location, and now you have twelve sites silently wrong instead of one. Catch it at site one.
A real scenario
A regional food-processing operation added pressure and temperature sensors to a cleanroom's HVAC to drive automatic PMs and deviation alerts. The integrator confirmed data was flowing, everyone signed off. During the first month, the maintenance lead ran a belated latency test because a temperature alert had felt "late" a couple of times.
Ingest latency was fine — around eight seconds. Action latency was 28 minutes, because the rule-evaluation job ran on a half-hour cron. For a cleanroom pressure deviation, 28 minutes is the difference between a caught excursion and a batch investigation. They also found one pressure sensor storing dropped readings as 0, which dragged the rolling average down and masked a slow drift.
The fixes were unglamorous: move rule evaluation off batch to a short interval, fix the null handling, add a scheduled validation check. Action latency dropped under two minutes and the false-clean average disappeared. No new hardware, no re-integration — just verification that should have run at handoff. The whole thing took most of an afternoon and avoided at least one probable batch loss, which in that facility runs into five figures.
Bad integrations ship not because of incompetence, but because "data is flowing" feels like success. The difference between flowing and correct is invisible until it costs you. The checklist above makes that difference visible in an afternoon, before it makes itself visible in a spoiled batch or a missed alarm.
Run the three layers. Force a named signoff. Schedule the validation so it doesn't quietly stop happening after install number three. And if you're also worried about preserving history through a system change rather than a fresh sensor rollout, the same evidence-first mindset carries over to how you'd protect auditability during a CMMS cutover — verify before you trust, every time.
Ready to optimize your maintenance operations?
Join 2,000+ facilities using Openfixit to reduce unplanned outages, extend asset life, and improve operational efficiency.