


The repair-vs-replace decision is where maintenance and finance quietly disagree with each other for years without anyone writing it down. A chiller compressor fails in July. The technician says replace the whole unit. The controller says patch it — there's no capex left in the budget. Both are working from gut feel, and whoever pushes harder wins. Then twelve months later the same asset fails again, and now everyone's pointing fingers about who made the call.
That's not a knowledge problem. Nobody in that room is stupid. It's a policy problem. There was no shared rulebook that said, under these specific conditions, this is what we do — and here's the math that proves it.
A capital allocation maintenance policy fixes that by turning a hundred one-off arguments into a repeatable decision process. It does two things at once: gives your team a consistent way to decide repair vs replace, and gives finance a defensible paper trail they can take to the CFO or an auditor without flinching. This article is about how that system actually works end to end — the thresholds, the payback math, the residual-value logic, and how you bolt it into the budget cycle so it doesn't die in a spreadsheet somebody forgets to open.
Why the repair-vs-replace decision breaks down in the first place
Most teams don't have a policy. They have habits. And those habits drift depending on who's on shift, how the budget looks that quarter, and how tired everyone is of a particular asset.
-
The "just keep it running" trap. Maintenance keeps repairing an asset because each individual repair is small enough to approve without asking anyone. Nobody adds up the year. A pump that eats $600–$900 in parts every four months feels cheap in the moment and costs you close to $2,400 a year on a unit that's worth maybe $3,000 new.
-
The capex famine distortion. When there's no capital budget left, everything becomes a repair — even things that obviously should be replaced — because opex is the only door that's open. This is the single most common reason good assets get run into the ground.
-
The emotional replace. The opposite failure. An asset embarrasses the team enough times that they replace it early, out of frustration, even though it had two or three good years left.
-
The invisible carrying cost. Nobody tracks the downtime, energy waste, or overtime that a limping asset generates. Those costs are real, they just don't land on a work order.
Underneath all of these is the same root issue: repair decisions get made at the technician level, replace decisions get made at the finance level, and the two groups are using completely different information. Maintenance sees failure frequency and part condition. Finance sees book value and budget lines. Neither sees the whole picture, so neither decision is defensible.
What a defensible policy actually contains
A policy is "defensible" when someone outside the room — an auditor, a new VP, a board member — can look at a decision and follow the logic without you standing there explaining it. That means the rules have to be written down, the inputs have to come from your CMMS, and the math has to be reproducible.
Eliminate downtime with proactive maintenance.
Openfixit helps you plan, track, and complete maintenance efficiently—maximizing asset reliability.
- Centralized asset management
- Automated maintenance scheduling
- Inventory and parts tracking
No credit card required
At minimum, a working policy needs five components:
-
Decision triggers — the conditions that force a repair-vs-replace evaluation instead of an automatic repair.
-
Repair-cost thresholds — expressed as a percentage of replacement value, tied to asset class.
-
A payback calculation — for the replace option, how fast the investment pays back through avoided repairs, energy, and downtime.
-
Residual-value rules — what the current asset is actually worth, and what you recover if you replace it.
-
Approval routing — who signs off at each dollar band, and how it connects to the budget cycle.
The mistake most teams make is building only the first two. They set a threshold — "replace if the repair exceeds 50% of replacement cost" — and call it a policy. That rule is fine as a trigger, but on its own it's shallow. A 50% repair on an asset with one year of life left is a terrible idea; a 60% repair on an asset with eight good years and a rebate available might be smart. The threshold tells you when to look closer. The payback and residual math tell you what to actually do.
The trigger rules: when a repair stops being automatic
Not every failure deserves a capital analysis. If you evaluate a $200 belt replacement with a full payback model, your team will — correctly — ignore the policy within a month. The point of trigger rules is to filter: automatic repairs stay automatic, and only the genuinely gray decisions get escalated.
A practical trigger set looks like this. A repair-vs-replace evaluation kicks off when any one of these is true:
-
The proposed repair exceeds a set percentage of replacement value (varies by asset class — more on that below).
-
The asset has had three or more failures on the same failure mode within a rolling 12 months.
-
The asset is past a defined percentage of its expected useful life (commonly 80%).
-
A repair would require a part with a lead time long enough to threaten uptime, and a replacement is available faster.
-
The repair triggers a compliance or safety obligation that a new unit would eliminate.
That recurring-failure trigger matters more than people expect. It catches the "just keep it running" trap before it drains a year of budget. If you want to get disciplined about why those failures keep happening before you spend on either path, a work-order–linked root cause process feeds this decision directly — you don't want to replace an asset that's failing because of a control loop problem upstream.
Repair-cost thresholds by asset class
A single threshold across all assets is lazy and wrong. A rooftop unit and a submersible pump age differently, cost differently to replace, and carry different downtime risk. The threshold — repair cost as a percentage of replacement cost — should flex by class.
Here's a starting framework. Treat these as defaults you tune with your own history, not gospel:
| Asset class | Repair-cost threshold (of replacement) | Typical useful life | Notes |
|---|---|---|---|
| Rooftop HVAC / chillers | 40–50% | 15–20 yrs | Energy efficiency of new units often shifts the math toward replace earlier |
| Pumps / motors | 50–60% | 10–15 yrs | Rewinds can be cost-effective; watch cumulative rewind count |
| Air handlers | 45–55% | 20–25 yrs | Long life means residual value stays meaningful late |
| Building controls / BAS panels | 30–40% | 10–12 yrs | Obsolescence risk pushes replace decisions earlier than wear alone |
| Emergency generators | 50–60% | 20–25 yrs | Compliance and reliability weight the replace side heavily |
| Small equipment (fans, VFDs) | 60–70% | 8–12 yrs | Low replacement cost makes replace the default once repairs climb |
The most useful column in that table is actually the notes column, because it captures what raw percentages miss. HVAC replacement math is distorted by energy: a 12-year-old unit might clear the repair threshold, but a new unit running 20–30% more efficiently changes the payback enough that you replace it well before the percentage says to. Controls get replaced early not because they wear out but because you can't get parts anymore. A good threshold table encodes those realities instead of pretending everything ages on a straight line.
Working the payback math: a real example
Thresholds trigger the evaluation. Payback resolves it. Here's a worked example you can adapt.
The asset: a 60-ton rooftop unit, about 14 years into an expected 18-year life. It's tripped on the same compressor circuit three times in the last ten months.
The repair path:
-
Compressor replacement quote
~$8,500 installed
-
Expected to buy roughly 2–3 more years before the next major failure
-
Unit is already running maybe 15% less efficiently than a modern equivalent
-
Estimated annual energy penalty vs. a new unit
around $1,800–$2,200
-
Two failures this cooling season cost roughly $3,000 in emergency labor and one half-day of partial downtime
The replace path:
-
New high-efficiency 60-ton RTU
~$34,000 installed
-
Utility efficiency rebate available
~$3,500
-
Net replacement cost
~$30,500
-
Annual energy savings vs. keeping the old unit
~$2,000
-
Expected to eliminate the recurring emergency repairs
Run the repair percentage first: $8,500 / $34,000 ≈ 25%. That's under the 40–50% HVAC threshold, so a naive threshold-only policy says "just repair it." This is exactly where shallow policies fail.
Now layer in the full picture. The repair buys you 2–3 years but leaves you paying ~$2,000/yr in energy waste and exposed to another compressor event on a 14-year-old unit. Over three years the repair path realistically costs $8,500 + (~$6,000 energy penalty) + a fair chance of another $3,000–$5,000 emergency = roughly $17,500–$19,500, and at the end you still own a 17-year-old unit worth almost nothing.
The replace path costs $30,500 up front, saves ~$2,000/yr, removes the emergency risk, and resets the useful-life clock. The incremental spend to replace vs. repair is about $22,000, and against combined energy plus avoided-failure savings of roughly $4,000–$5,000/yr, the payback lands somewhere around 4.5–5.5 years — comfortably inside the remaining life of a new unit.
The point isn't the exact number. It's that the threshold said repair and the payback analysis said it's close enough that you should evaluate replace seriously, especially with the rebate on the table. A defensible policy makes you run that second calculation instead of stopping at 25%.
Residual value: the number everyone forgets
Residual value works two ways in this decision, and teams usually ignore both.
First, there's the residual value of the asset you're deciding about — its remaining book value and, separately, its salvage or trade-in value. Replacing an asset with meaningful book value left can create a write-off that finance needs to plan for. That's not a reason to keep a bad asset, but it is a reason to coordinate the timing so it doesn't blow up a quarter.
Second, there's the residual value of the new asset at the end of your planning horizon. If you're comparing a repair that gets you 3 years against a replacement with 18 years of life, comparing only the first 3 years is dishonest. The replacement still has 15 years of value left. Any comparison that ignores that overstates the cost of replacing.
A simple way to keep this honest is to normalize both options to an equivalent annual cost — total lifecycle cost divided by years of service delivered. On the RTU example above, the repair delivers ~$18,000 over 3 years = ~$6,000/yr of service. The replacement delivers ~$30,500 net (minus ~$4,000/yr savings) over ~18 years, which nets out to well under $2,000/yr once you spread it correctly. Suddenly the "expensive" option is the cheaper one per year of service, and now you have a number finance can't argue with.
This is also where the capex-vs-opex classification matters, because how the spend is booked changes who approves it and which budget it hits. If you haven't nailed down those rules, the residual and lifecycle logic here connects directly to how you map maintenance budgets to asset lifecycles and finance with defendable capex-vs-opex rules — the two systems have to agree or your policy contradicts your books.
Wiring the policy into the budget cycle
A policy that only exists at the moment of failure is half a policy. The most expensive replacements almost never happen as emergencies — they happen because someone saw them coming a year out and got them into the capital plan. If your repair-vs-replace logic doesn't feed your annual budget, you'll perpetually be making these calls under duress with no capex available, which forces the capex famine distortion every single time.
Here's a workflow that connects the two:
-
Continuous flagging. Throughout the year, every asset that trips a trigger rule gets flagged in the CMMS as a candidate for evaluation — not necessarily acted on immediately, but recorded.
-
Quarterly evaluation batch. Once a quarter, the flagged candidates get the full payback and residual analysis. Most will resolve as repairs; a handful surface as replace candidates.
-
Annual capital nomination. The replace candidates roll into the capital budget request with their payback math already attached. This is the difference between "we need money for chillers" and "here are six assets, here's the payback on each, here's which three we recommend funding."
-
Ranking and bundling. Not every justified replacement gets funded in one year. You rank them against safety, operational impact, and payback, and bundle where it makes sense — replacing two units on the same roof in one mobilization saves on labor.
-
Approved list becomes the pre-authorization. Anything on the funded list can be executed when it fails without re-fighting the whole battle, because the analysis is already done and the money is allocated.
That ranking-and-bundling step is its own discipline. When you have more justified projects than budget — which is almost always — a structured project-scoring and bundling matrix for deferred maintenance keeps the decision from becoming a popularity contest between department heads.
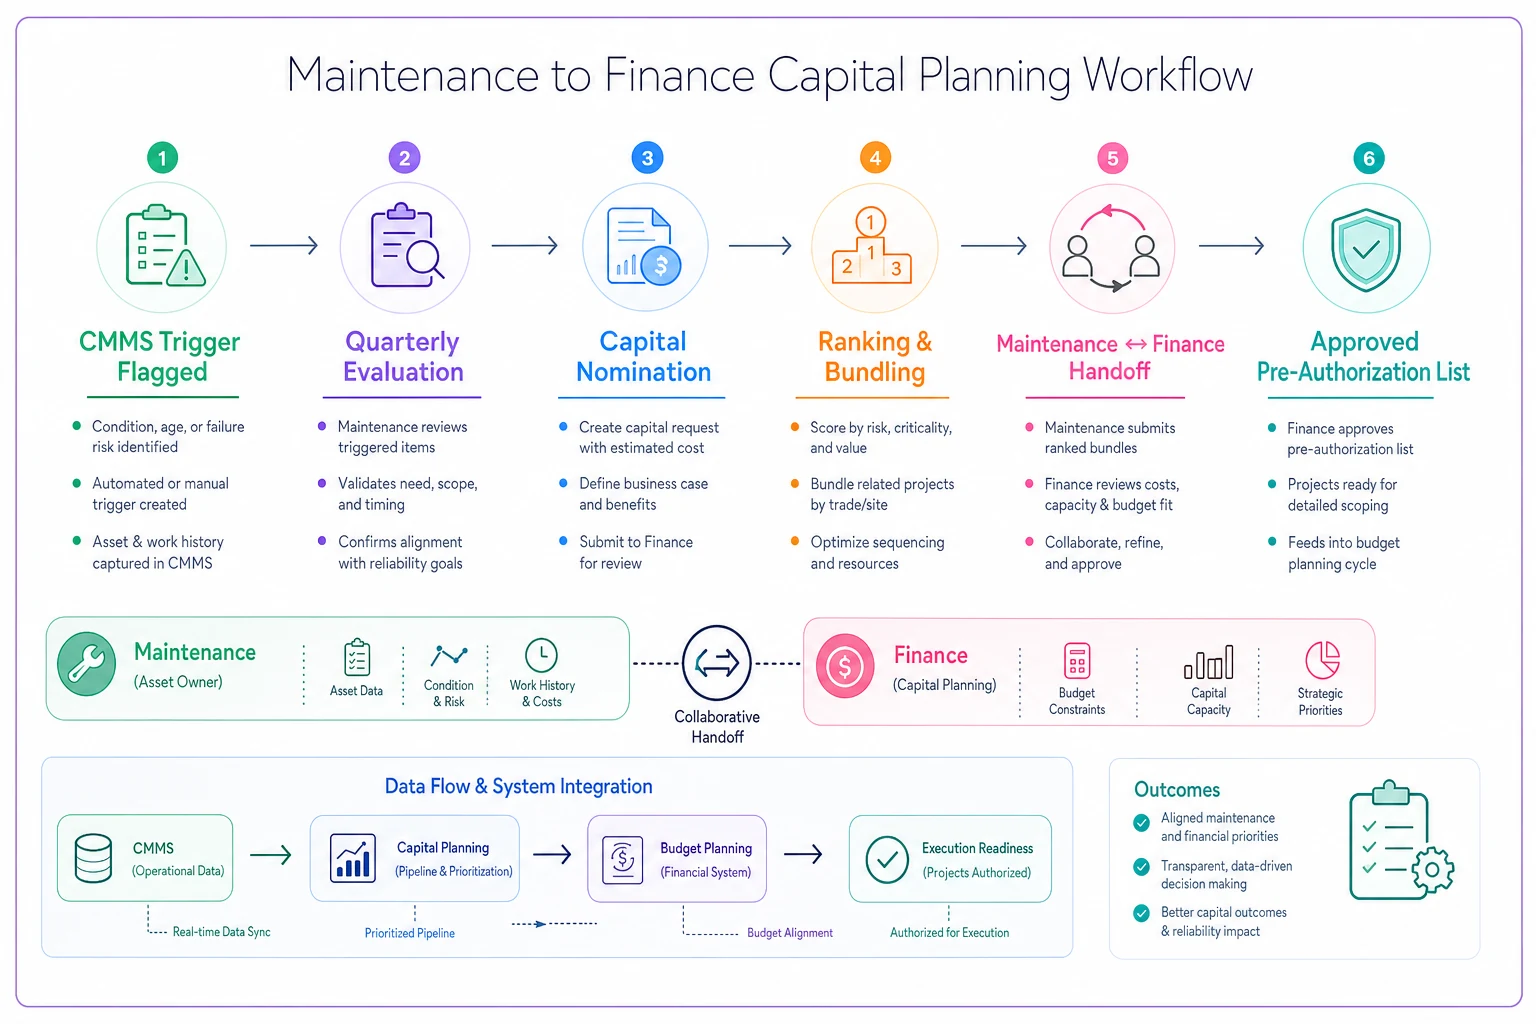
The quiet advantage of this cycle is that it turns emergencies into scheduled work. When a pre-authorized asset finally fails, you're not scrambling for approval — you're executing a decision you made calmly six months earlier.
Where good policies quietly fall apart
A policy on paper and a policy in practice are different animals. A few failure points show up repeatedly:
-
The inputs aren't in the CMMS. If failure history, repair costs, and asset age live in someone's head or in scattered spreadsheets, the payback math can't be reproduced, which means it isn't defensible. The policy is only as good as the data feeding it.
-
The thresholds never get tuned. Teams set thresholds once and never revisit them against actual outcomes. If you're consistently replacing assets that then run trouble-free for a decade, your threshold might be too aggressive — or too conservative in the other direction.
-
Finance and maintenance keep separate versions. The whole point is a single rulebook. The moment maintenance is working off one set of thresholds and finance is applying different logic in the budget review, you're back to arguing.
-
Nobody owns the flagged list. Candidates get flagged and then nobody runs the quarterly evaluation, so the list becomes noise. This needs a named owner and a recurring calendar slot.
The data problem is the one that quietly kills more policies than any other. When repair costs are inconsistently logged — some on the work order, some buried in a PO, some not captured at all — you can't calculate a repair-cost percentage you'd stake your job on. This is where an operational platform that keeps failure history, repair costs, and asset lifecycle data in one place actually earns its keep: not because it makes the decision for you, but because it makes the decision reproducible.
Make a CMMS data-owner responsible for ensuring failure history, repair costs, and asset age are consistently recorded so payback math is auditable.
When the payback math pulls from the same records finance can audit, the argument goes away. Both sides are looking at the same numbers, and the rulebook actually holds.
When a formal policy makes sense — and when it's overkill
Not every operation needs this. A single-building site with a dozen major assets and a maintenance lead who knows every one of them personally can probably run on judgment plus a light threshold rule. The overhead of a quarterly evaluation batch isn't worth it at that scale.
This policy earns its keep when:
-
You run multiple sites and can't hold every asset's history in your head.
-
Capital and operating budgets are controlled by different people who don't naturally coordinate.
-
You've been burned by an emergency replacement that should have been foreseen.
-
Auditors or ownership are starting to ask why specific spending decisions were made.
It's probably overkill when:
-
Your asset base is small and stable.
-
One person genuinely owns both the maintenance and the budget call.
-
Your capital spend is low enough that a bad repair-vs-replace decision doesn't move the year.
One word of caution for teams tempted to over-engineer it: don't build a 40-input model that requires an analyst to run. A policy that's too heavy gets abandoned faster than one that's too simple. The best version is the one your team will actually use every quarter without dreading it.
A short real-world scenario
A regional operator running about a dozen mid-size commercial buildings kept getting surprised by capital requests. Every summer, three or four HVAC units would fail hard, and every summer maintenance would ask for emergency capital that wasn't in the plan. Finance started saying no by default, which pushed the team into endless expensive repairs on units everyone knew were finished.
They built a shared threshold table by asset class, added the recurring-failure trigger, and started running a quarterly evaluation of flagged assets with payback and residual math attached. The first cycle surfaced seven replacement candidates; they funded four based on payback and downtime risk, and bundled two of them onto the same roof to save on mobilization.
The next cooling season, emergency capital requests dropped to roughly a third of the prior year, because most of the high-risk units had already been replaced on a planned schedule. Just as important, the arguments changed tone — instead of maintenance and finance negotiating from gut feel, both were pointing at the same payback numbers. The decisions weren't always easy, but they were finally defensible.
Bringing it together
The repair-vs-replace decision will never be fully automatic, and it shouldn't be — there's judgment in every one of these calls. But judgment applied inconsistently, with no shared math and no paper trail, is how good money gets spent on dying assets and good assets get scrapped early.
A real capital allocation maintenance policy doesn't remove the judgment. It gives it structure: triggers that decide when to look closer, thresholds tuned to how each asset class actually ages, payback and residual math that survives an audit, and a budget cycle that turns predictable failures into planned work instead of summer emergencies. When maintenance and finance are finally reading from one rulebook, the fights stop — not because everyone agrees on everything, but because everyone's arguing from the same numbers. That's the whole game.
Ready to optimize your maintenance operations?
Join 2,000+ facilities using Openfixit to reduce unplanned outages, extend asset life, and improve operational efficiency.