

Most facility teams already know downtime is expensive. What they don't have is a number they can actually defend at the moment it matters — when a chiller trips on a Saturday, the vendor quotes emergency mobilization, and someone has to decide whether to authorize it or wait until Monday.
That decision usually gets made on gut feel. And gut feel is where money leaks. Either the team over-authorizes emergency spend on assets that could've waited, or they hold off on something that quietly racks up production loss, spoilage, or a comfort complaint that eventually turns into a lease dispute.
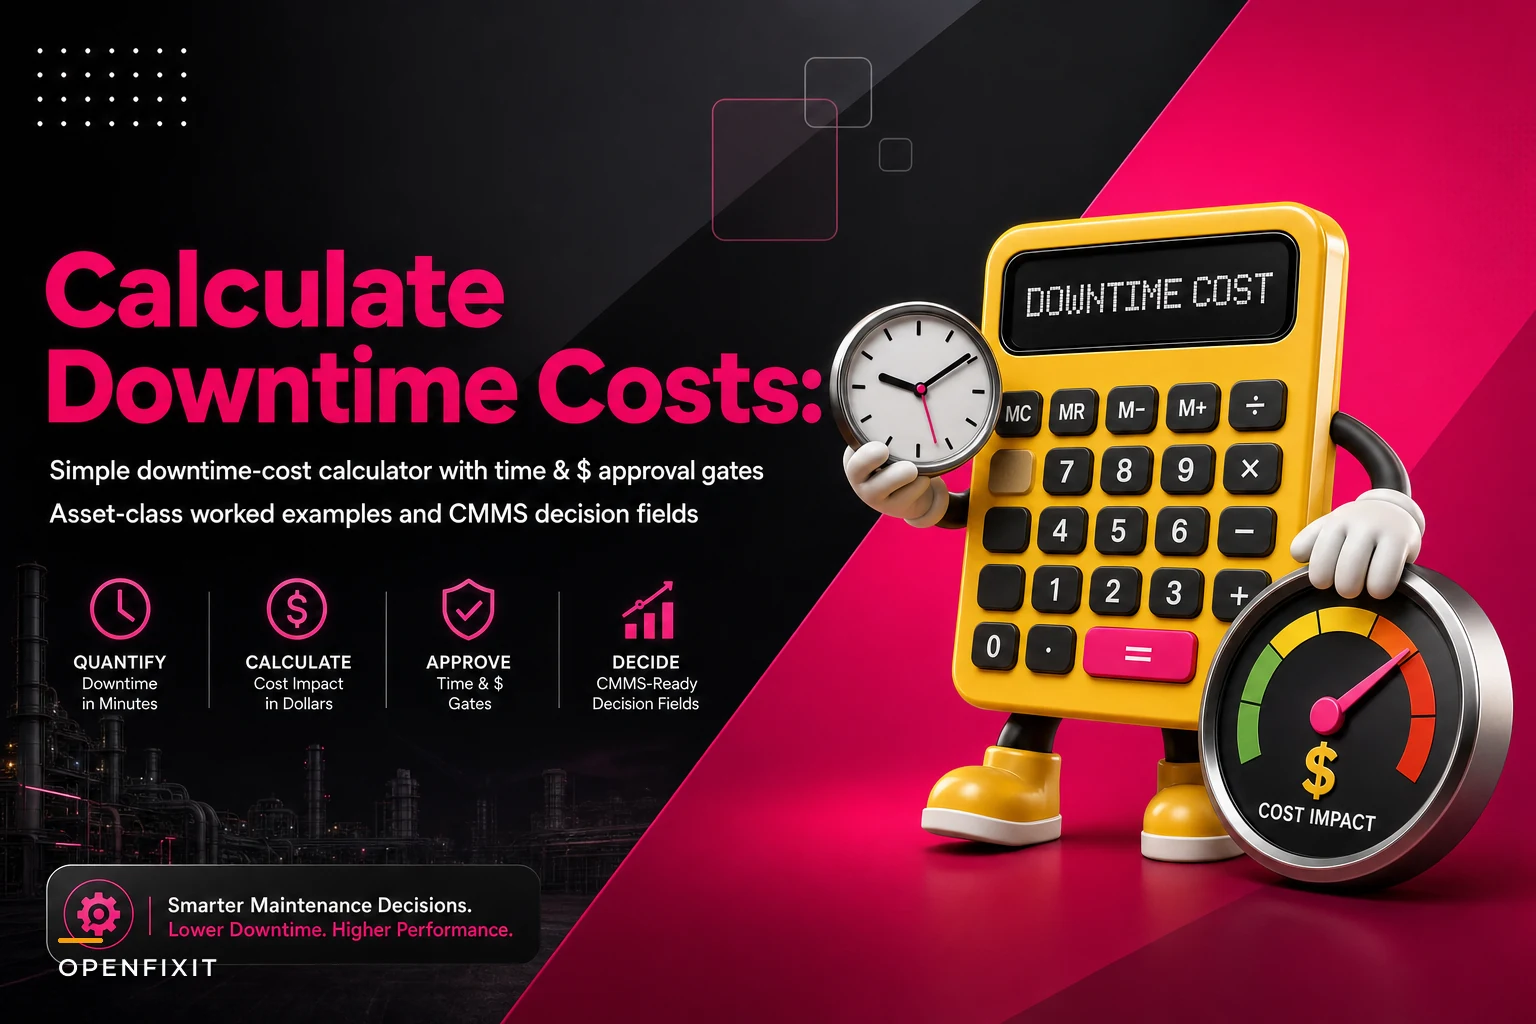
This piece is about building a downtime cost calculator for maintenance that's simple enough to use under pressure, tied to approval thresholds so people know who can say yes to what, and wired into your CMMS so the reasoning behind an emergency call actually gets captured. Not a spreadsheet that lives on someone's laptop — an actual field-level process.
The core problem: downtime cost is only useful if it exists before the emergency
There's a pattern that shows up constantly. A facility has a beautiful downtime cost model — built by a consultant, or a very motivated reliability engineer — living in a 40-tab spreadsheet. Technically accurate. Completely useless at 2am when a compressor is down and the on-call manager is texting.
The calculator that actually works is the one a technician or supervisor can run in about 90 seconds. That means it has to be built on numbers you already have, not numbers you have to go dig up mid-incident.
The second failure is subtler. Even when a team has a number, they don't have a threshold. So the cost estimate comes back at $8,000 in downtime — okay, now what? Who's allowed to authorize a $6,000 emergency repair to avoid it? The maintenance supervisor? Only the facility director? Does the answer change at 6pm versus 6am? Without pre-agreed thresholds, every emergency becomes a phone tree. And the phone tree is where the delay — and the real cost — lives.
A downtime cost calculator you can actually run fast
Strip it down to five inputs. Anything more and it won't get used.
Eliminate downtime with proactive maintenance.
Openfixit helps you plan, track, and complete maintenance efficiently—maximizing asset reliability.
- Centralized asset management
- Automated maintenance scheduling
- Inventory and parts tracking
No credit card required
-
Hourly downtime rate ($/hr) — the pre-calculated cost of this asset or asset class being down for one hour. This is the number you build ahead of time, not during the event.
-
Estimated time to repair (hrs) — the technician's or vendor's honest estimate, not the optimistic one.
-
Estimated time if you wait (hrs) — total downtime if you defer to normal hours or the next available slot.
-
Emergency premium ($) — the extra cost of acting now
overtime, expedited parts, vendor mobilization, weekend rates.
-
Safety/compliance flag (yes/no) — a hard override. If yes, the calculator is advisory only; you act.
The logic is straightforward:
-
Cost of acting now = (repair time × hourly downtime rate) + emergency premium
-
Cost of waiting = wait time × hourly downtime rate
-
Net benefit of acting now = cost of waiting − cost of acting now
If the net benefit is clearly positive and above your threshold, you authorize. If it's negative, you probably wait. If it's close, that's exactly the zone where a human with context should decide — and where the CMMS notes matter most.
The hard part isn't the math. It's the hourly downtime rate. That's the number worth investing in ahead of time, because everything downstream depends on it.
Building the hourly downtime rate per asset class
You don't need per-asset precision to start. Asset-class rates get you most of the way there and are far more maintainable. Here's how the rate actually gets built, based on what kind of loss the asset drives:
-
Revenue/production loss units per hour × margin per unit, or booked revenue per hour that stops when the asset stops.
-
Spoilage/scrap value of product at risk per hour of outage — refrigeration, process cooling, anything with a perishable component.
-
Labor idle cost people who can't work when the asset is down × loaded labor rate.
-
Regulatory/comfort exposure harder to quantify, so many teams assign a fixed penalty value or a flag rather than a per-hour rate.
-
Cascading damage cost per hour of the outage making things worse — water intrusion, equipment overheating, that kind of thing.
A quick note on sourcing these numbers: don't chase perfection. A defensible range beats a precise fiction. If ops tells you a packaging line runs "around 1,100–1,300 units an hour at roughly $0.90 margin," use $1,000/hr as a conservative rate and move on. You can refine it later.
Worked examples across four asset classes
These are illustrative, but the structure is what matters — this is what the numbers look like when you actually sit down and build them.
| Asset class | Hourly downtime rate | Scenario | Cost of acting now | Cost of waiting | Decision |
|---|---|---|---|---|---|
| Packaging line motor | ~$1,000/hr | Fails Friday 4pm; 3hr repair now vs. 20hr wait to Monday. Emergency premium ~$1,200 (OT + expedite) | (3 × $1,000) + $1,200 = $4,200 | 20 × $1,000 = $20,000 | Act now — net benefit ~$15,800 |
| Rooftop AC unit (office, mild weather) | ~$150/hr | Compressor down, 5hr repair now vs. 48hr wait for parts. Premium ~$900 | (5 × $150) + $900 = $1,650 | 48 × $150 = $7,200 | Marginal — depends on tenant/comfort flag |
| Walk-in freezer (restaurant) | ~$2,500/hr (spoilage) | Down Saturday night; 2hr emergency response vs. 6hr wait. Premium ~$1,500 | (2 × $2,500) + $1,500 = $6,500 | 6 × $2,500 = $15,000 | Act now — spoilage dominates everything |
| Backup generator (data-adjacent) | Compliance flag | Fails weekly test; no immediate load loss | N/A | N/A | Safety/compliance flag = act, calculator advisory only |
Two things worth pulling out of this table.
The rooftop AC case shows why a single number isn't enough. In mild weather the math says wait. In a heat event with tenants in the building, the comfort and lease exposure flips it entirely — which is exactly why the flag exists alongside the dollar math. Prioritization logic like this pairs well with a structured work-order triage matrix, so the downtime number feeds into an existing priority scheme rather than sitting off to the side.
The freezer case is the one teams consistently get wrong. Spoilage rates dwarf equipment repair costs, and teams that price freezers on repair labor alone keep under-authorizing emergency response and then eating five-figure spoilage losses. The hourly rate has to reflect what's at risk, not just what's being fixed.
Approval thresholds: who says yes, and how fast
A cost number without an authority map just moves the bottleneck. The point of thresholds is to let people act at the level they're trusted to, without waiting on a callback. Set them on two axes — dollars and time — because a $3,000 call that can wait until morning is a different decision than a $3,000 call that has to happen in 20 minutes.
-
Technician / on-call authorize up to ~$1,500 emergency spend when net benefit is positive and no safety flag. Log it, don't ask.
-
Supervisor up to ~$5,000, or any decision involving a comfort or compliance flag.
-
Facility manager up to ~$15,000, or any deferral where cost-of-waiting exceeds cost-of-acting by more than 3×.
-
Director / finance anything above that, or capital-level emergency replacement.
The most common mistake is setting thresholds too low. If your on-call tech can only authorize $500, you've guaranteed that every real emergency wakes up two more people and adds 30–60 minutes of delay — which on a high-rate asset often costs more than the repair you were trying to control. Push the numbers up until the authority matches the risk the person is already managing on-site.
One more piece that ties into budgeting: thresholds should map to how emergency spend gets coded afterward. When an emergency repair blurs into a partial replacement, that's a capex-vs-opex question, and having the reasoning captured up front makes the reconciliation cleaner. That mapping between emergency decisions and finance is its own discipline — worth aligning with your maintenance budget and asset-lifecycle framework so surprise charges don't blow up the books later.
The part everyone skips: CMMS fields to capture the rationale
Here's what usually happens after an emergency call gets made. The repair gets done, the work order gets closed, and the reason it was authorized evaporates. Three months later, finance questions a $6,800 weekend charge and nobody can reconstruct why. The tech who made the call is on vacation. The estimate that justified it was verbal.
This is fixable with a handful of CMMS fields on emergency work orders. Not a lengthy form — just enough structure that the decision is auditable and the data becomes useful over time.
-
Downtime cost estimate ($/hr used) — which rate was applied
-
Estimated repair time and estimated wait time — the two inputs that drove the comparison
-
Calculated net benefit — the number the decision was based on
-
Emergency premium paid — actual, filled in at close
-
Safety/compliance flag — yes/no, with a short reason if yes
-
Authorized by — name and role, tied to the threshold level
-
Decision note (free text) — one or two sentences on anything the numbers didn't capture ("tenant escalation," "only vendor slot available was Saturday," "risk of coil freeze-up")
Below is a simple workflow showing how the CMMS fields tie the calculator to approvals.
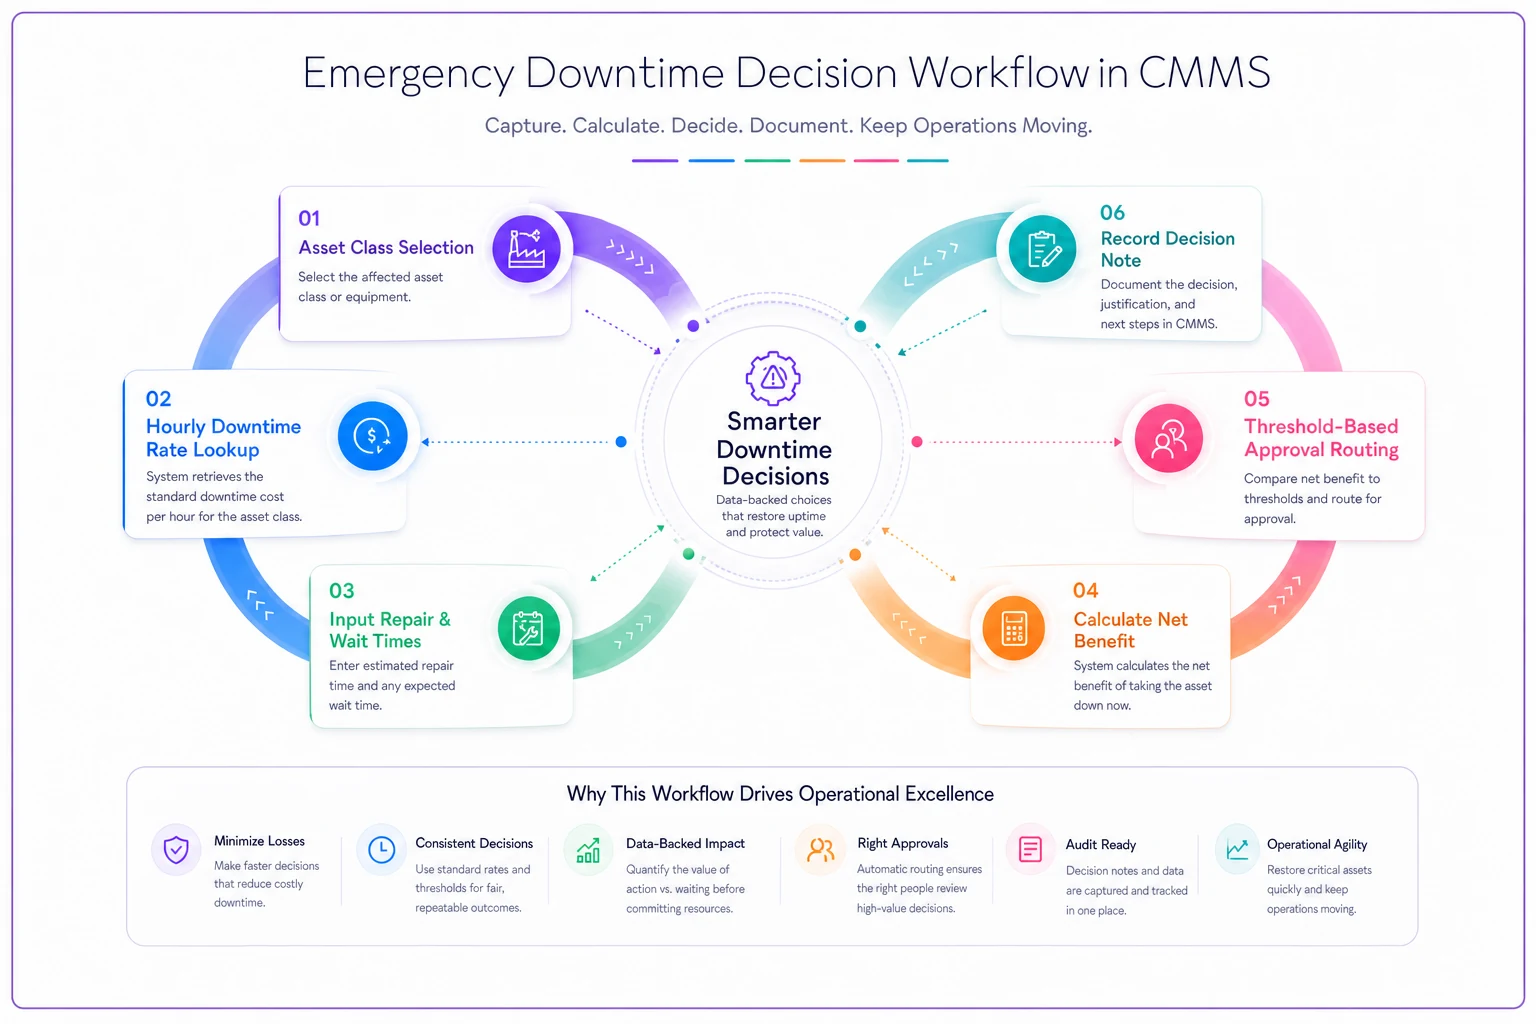
That decision note is the field that pays off most over time. Numbers tell you what the model said; the note tells you why a human overrode it — which is where you learn whether your rates are off or your thresholds are too tight.
Over a year, those fields turn into something genuinely useful: a record of every emergency call, what it cost, whether the model agreed, and how often you deferred and regretted it. That's how you turn rough guesses into defensible rates. A modern CMMS with configurable fields and some light automation earns its keep here — auto-populating the estimate math from the asset class, flagging when a proposed spend exceeds the technician's threshold, routing the approval to the right person without a phone tree. The value isn't the automation itself; it's that the right person gets the right number fast, and the reasoning is captured without extra work.
A real scenario: mid-size cold-storage distributor
A regional food distributor with a handful of walk-in freezers and a small in-house maintenance team kept getting burned on refrigeration calls. Their pattern: on-call authority was capped at $500, so every after-hours freezer alarm meant waking the operations director, a 40-minute discussion, and only then a vendor callout. Meanwhile product sat warming.
They built freezer downtime rates around spoilage — roughly $2,000–$2,800/hr depending on how full the units were — and raised on-call authorization to $2,000 for flagged refrigeration assets. They added the CMMS decision fields above to every emergency work order.
Over the following six months or so, average response-to-authorization time on freezer alarms dropped from close to an hour down to under 15 minutes. Two events during that stretch had captured net-benefit math that clearly justified emergency callouts — calls that previously would've been debated for too long. On the flip side, the decision notes revealed that two summer AC callouts were over-authorized; the model would've said wait. That led them to tighten the comfort flag rules for non-critical areas.
Net result: fewer spoilage losses, and somewhere in the range of $9k–$12k in avoided unnecessary emergency AC spend over the same period, mostly from not panicking on assets that could wait. The interesting part wasn't the savings number. It was that finance stopped questioning the emergency charges, because every one of them came with a rate, a comparison, and a name attached.
When this makes sense — and when it doesn't
This approach earns its keep when you have assets with genuinely variable downtime cost — some cheap to lose, some catastrophic — and enough after-hours or emergency events that the decision keeps recurring. Cold storage, production lines, tenant-facing HVAC, and process utilities are the obvious fits.
-
Cold storage
-
Production lines
-
Tenant-facing HVAC
-
Process utilities
It's overkill for a small single-site operation where the facility manager is on every call anyway and knows every asset personally. If one person makes every decision and it works, formal thresholds just add paperwork. Build the hourly rates for your top few critical assets, keep the note field, and skip the rest.
Worth saying plainly: don't let the calculator become the decision-maker. The safety and compliance flag exists precisely because some outages aren't a dollar question. The model is there to make the economic calls fast and defensible, and to stop the borderline ones from turning into 45-minute phone calls. Where life-safety or regulatory exposure is on the table, the number is advisory and you act.
Getting started without boiling the ocean
Pick your five most critical assets or asset classes. Build a rough hourly downtime rate for each — ranges are fine. Set two or three approval thresholds that match who's actually on call. Add the CMMS fields to your emergency work-order template. Run it live for a quarter and let the decision notes tell you where your rates and thresholds are wrong.
That last step is the one most teams skip. They build the model, use it a few times, and never look back at whether the numbers held up. The decision notes exist to close that loop — to tell you whether a $2,000/hr spoilage rate was too conservative or not conservative enough, and whether your technicians are using their authorization limit or still calling up the chain out of habit.
The whole point is that when the compressor trips on a Saturday, the person standing in front of it already knows the number, already knows if they can authorize it, and can capture why they decided what they decided — before the reasoning evaporates. That's the difference between a downtime model that lives in a spreadsheet and one that actually protects uptime and cash when it counts.
The whole point is that when the compressor trips on a Saturday, the person standing in front of it already knows the number, already knows if they can authorize it, and can capture why they decided what they decided — before the reasoning evaporates. That's the difference between a downtime model that lives in a spreadsheet and one that actually protects uptime and cash when it counts.
Ready to optimize your maintenance operations?
Join 2,000+ facilities using Openfixit to reduce unplanned outages, extend asset life, and improve operational efficiency.