


Most maintenance teams don't have an analytics problem. They have a maturity mismatch problem.
The dashboards look fine. The CMMS exports cleanly. Somebody even built a nice MTBF chart. But when a VP asks "should we replace the chiller or keep patching it?", the answer still comes from gut feel, a hallway conversation, or whoever argues hardest in the budget meeting. The data exists — it just never climbs the ladder into an actual decision.
That gap — between having analytics and acting on them — is what a maturity model is supposed to close. Not by adding more charts, but by matching the kind of decisions you're trying to make to the data capability you actually have. A Stage 1 team trying to run Stage 4 predictive capital planning will drown. A Stage 4 team still approving replacements on a hunch is wasting money it already has the data to save.
This article lays out the stages, what capability each one requires, what the dashboards actually look like, and — the part most models skip — how each stage changes who approves what. Because maintenance analytics maturity only matters if it reaches the people signing checks.
Why most maturity models stay on the shelf
The typical maturity model is a pyramid with four or five tiers and some aspirational language about "predictive" and "prescriptive." Fine as a poster. Useless as an operating tool, because it never answers the only question leadership actually cares about: what decision does this unlock?
The pattern you see in facilities organizations that stall: they treat maturity as a data-collection milestone. "We have good uptime data now, so we're Stage 3." But nothing downstream changed. Finance still treats every large repair as a one-off approval. Operations still escalates based on whoever's yelling loudest. The analytics matured; the decisions didn't.
The real test of a stage isn't what you can measure — it's what you're allowed to decide because of what you measure. When you tie each stage to a specific class of decision — a dollar threshold, an approval path, an executive action — the model stops being a vanity exercise and starts moving money.
A second pattern worth naming: teams skip stages. They buy vibration sensors and a predictive platform while their work-order data is still 40% uncoded "general repair." Prescriptive analytics on garbage inputs just produces confident garbage. Maturity is cumulative. You can't rent your way past the foundational stages, no matter how good the vendor demo looked.
The five stages, and what each one actually earns you
Think of each stage as earning a decision right. As your data gets more trustworthy and connected, you earn the right to make bigger, faster calls with less debate.
Eliminate downtime with proactive maintenance.
Openfixit helps you plan, track, and complete maintenance efficiently—maximizing asset reliability.
- Centralized asset management
- Automated maintenance scheduling
- Inventory and parts tracking
No credit card required
| Stage | Data capability | Decision it earns | Who approves | Typical blind spot |
|---|---|---|---|---|
| 1 — Reactive | Work orders logged after the fact, inconsistent coding | "Did we fix it?" | Supervisor, verbal | No idea what things cost |
| 2 — Structured | Clean failure/asset coding, labor + parts captured per WO | Backlog priority, PM vs. reactive mix | Maintenance manager | Can't link cost to specific assets |
| 3 — Analytical | Cost-per-asset, MTBF/MTTR trends, downtime quantified | Repair-vs-replace under a threshold | Facility manager + finance review | Trends exist but aren't forecast |
| 4 — Predictive | Condition data + failure modeling, forecasted spend | Capital timing, budget defense | Director + capital committee | Models drift without governance |
| 5 — Integrated | Analytics tied to finance, risk, and ops outcomes | Portfolio-level capital allocation | Executive / CFO sign-off | Over-trusting the model |
Notice the right-hand columns. The jump from Stage 2 to Stage 3 isn't "more charts" — it's that a facility manager can now approve a $15k pump replacement without a committee, because the cost history defends the call. Stage 3 to 4 means you stop reacting to this year's failures and start funding next year's. Each stage moves the approval authority somewhere decisions happen faster and with less politics.
Stage 1 — Reactive
You're logging work, but the data is for proving work happened — not for deciding anything. Codes are inconsistent ("misc," "repair," "other" dominate). Labor hours are guessed at month-end. This is where most teams actually live, regardless of what they tell auditors.
The only honest executive action at Stage 1: invest in capture discipline before anything else. Any "insight" you produce here will be wrong in ways you can't see.
Stage 2 — Structured
Work orders now carry a real asset ID, a failure code that means something, and actual labor and parts. You can answer "what's eating our hours?" and "what's our PM-to-reactive ratio?" This is the first stage where analytics can shape operational decisions — backlog sequencing, crew assignment, PM frequency.
What breaks here: teams think clean data equals insight. It doesn't yet. You have ingredients, not a meal. The executive action is to formalize coding standards and make them non-optional at work-order close.
Stage 3 — Analytical
Now cost rolls up by asset and asset class. You can see that Chiller 2 has cost roughly $34k over 18 months across seven reactive events, versus a replacement at around $52k. You can quantify downtime. This is the first stage that touches capital decisions in a defensible way.
This is also where the dashboard-to-decision link usually snaps. Teams build analytical dashboards nobody uses for approvals. If you're stuck here, it's worth revisiting why most maintenance KPIs fail and how to build dashboards that lead to decisions — the fix is almost always designing the dashboard backward from the decision, not forward from the available data.
Stage 4 — Predictive
Condition data — vibration, thermal, runtime, pressure trends — feeds failure-mode models that forecast when, not just that. You can tell finance "three of our twelve AHUs will likely need major work in the next 18 months, here's the probable window and spend." That changes budgeting from reactive catch-up to planned capital.
The blind spot: governance. Models drift, sensors drift, and a forecast nobody validates becomes a liability. Predictive capability without ownership is just expensive optimism.
Stage 5 — Integrated
Analytics are wired into finance and risk. Repair-vs-replace, capex-vs-opex, and project prioritization all pull from the same trusted numbers. The CFO trusts the maintenance forecast enough to fund against it. At this stage, maintenance stops being a cost center defending itself and becomes a portfolio being managed. Getting the accounting plumbing right matters a lot here — the mechanics of mapping maintenance budgets to asset lifecycles and finance are what let analytics actually flow into capital plans instead of dying in a spreadsheet.
Sample dashboards, by stage
The dashboard should look boring at low stages and get richer as you climb. A Stage 2 team running a Stage 4 dashboard is cosplaying.
Stage 2 dashboard — operational control
-
PM completion % (planned vs. actual)
-
Reactive vs. planned work ratio
-
Open backlog by priority and age
-
Labor hours by craft
-
Top 10 assets by work-order count
Stage 3 dashboard — cost and reliability
-
Cost per asset and per asset class (trailing 12 months)
-
MTBF / MTTR trends by critical asset
-
Downtime hours and estimated downtime cost
-
Repair spend vs. replacement cost, by asset
-
Top 10 assets by cost, not count (different list, almost always)
Stage 4 dashboard — forecast and risk
-
Failure probability curves for critical assets
-
Forecasted 12–24 month capital need
-
Condition trend vs. alarm thresholds
-
Remaining useful life estimates
-
Confidence/accuracy of prior forecasts (the self-check almost nobody builds)
One thing that catches people off guard: the "top assets by count" list and the "top assets by cost" list usually share maybe two or three names. The equipment generating fifty nuisance work orders is rarely the thing quietly costing you $40k a year. Stage 2 can't see this. Stage 3 can. That single reordering is often worth the entire climb.
Decision-flows: wiring analytics into approvals
This is the part that turns a maturity model into an operating system. Each stage should correspond to a concrete approval flow with real thresholds. The numbers below are illustrative — set your own — but the structure is the point.
Repair-vs-replace decision flow (requires Stage 3+)
-
Reactive event logged against an asset with clean cost history.
-
System pulls trailing repair cost + downtime cost for that asset.
-
If cumulative repair cost exceeds ~50% of replacement cost over a rolling 24 months → flag for replace review.
-
If under threshold → approve repair at facility-manager level, no committee.
-
If flagged → route to finance with the auto-attached cost history as justification.
-
Decision and rationale written back to the asset record.
The elegance is step 4. Below the threshold, nobody debates it — the data already made the call, and the approval is near-instant. Above it, the escalation arrives with evidence attached instead of a manager's opinion. Maturity doing real work: it removes arguments at the bottom and sharpens them at the top.
Capital planning flow (requires Stage 4+)
-
Forecast models produce an 18–24 month projected capital list.
-
Each projected item carries a probability, a cost range, and a risk score.
-
Items above a risk threshold enter the next budget cycle automatically.
-
The capital committee reviews a ranked list, not a pile of individual pleas.
-
Approved items become planned work; declined items get a documented risk acceptance.
Compare that to the Stage 1–2 reality, where capital requests show up one panicked failure at a time and compete on urgency instead of merit.
The flow below shows how a repair event moves through this decision process — from initial log to either fast approval or escalation with evidence:
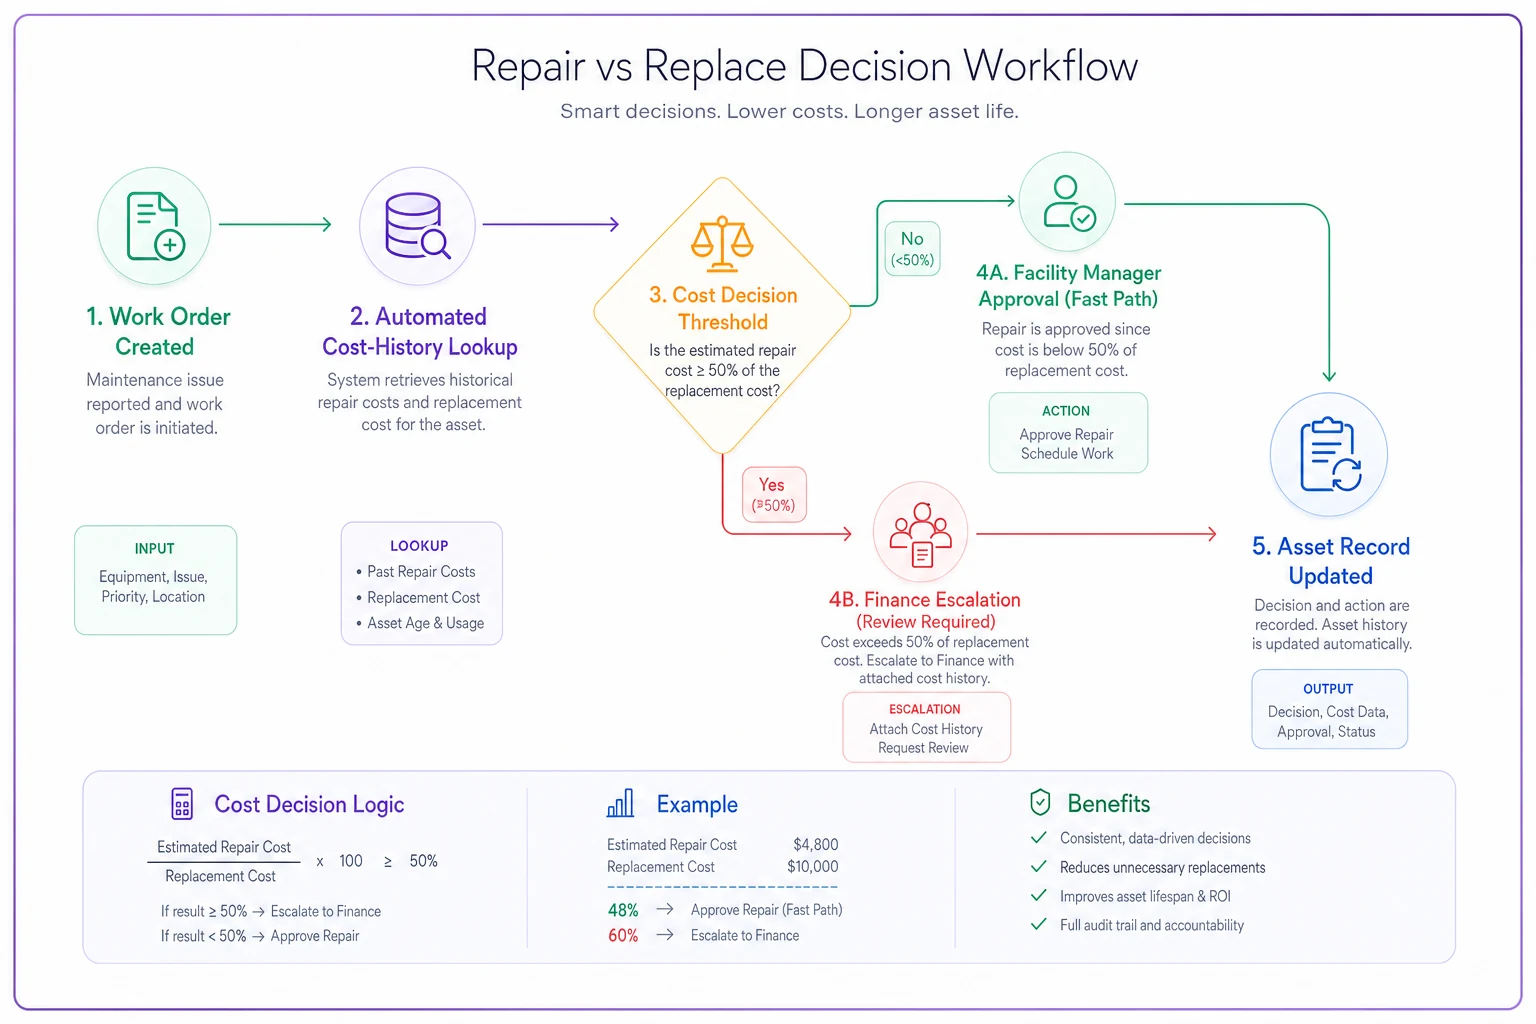
The diagram maps the automated decision path from log to asset update.
A realistic climb: one site's two years
A mid-size distribution facility — one site, around 1,100 tracked assets, six-person crew — sat firmly in late Stage 1. Work orders existed, but roughly 45% closed with no usable failure code, and labor was reconstructed monthly from memory. Every capital request was a fight because nobody could prove an asset's history.
They didn't buy sensors. The first quarter was just enforcing coding and labor capture at close-out — unglamorous Stage 2 work. By month five, reactive-vs-planned was finally measurable: sitting around 70% reactive, worse than anyone had wanted to admit.
By roughly month ten they'd reached Stage 3 — cost rolled up by asset. The reordering was immediate. Their "worst" equipment by complaint volume turned out to be cheap to maintain. Two air handlers that rarely generated complaints were quietly costing somewhere around $30k–$38k a year in repairs and downtime combined. Those moved to the top of the replacement list, and because the cost history was clean, the replacement got approved in one meeting instead of three.
By the two-year mark they were running basic predictive on about fifteen critical assets and defending a real capital forecast. Reactive work dropped to the low 40s percentage-wise. Nothing dramatic happened overnight. What changed was that budget conversations stopped being arguments and started being reviews of evidence.
When pushing to the next stage is a bad idea
Not every team should sprint up the ladder.
-
Your coding is still messy. Chasing predictive analytics on uncoded data wastes money and credibility. Fix capture first.
-
No one will act on the output. If finance won't change approval behavior based on your Stage 3 data, building Stage 4 forecasts is building a dashboard for the archive.
-
You can't maintain the models. Predictive capability you can't govern degrades silently and eventually gets you burned when a confident forecast is wrong.
-
The asset base doesn't justify it. A small, low-criticality portfolio might rationally stop at Stage 3 forever. Maturity is not a trophy; it's a fit.
And worth saying directly: teams buying tools to skip stages are spending money to cosplay at a higher maturity level. The condition-monitoring platform doesn't create maturity — it assumes you already have the foundation it's standing on.
A short checklist to find your real stage
Most teams rate themselves one stage higher than reality. Be honest.
-
[ ] Over 90% of work orders close with a meaningful failure/asset code
-
[ ] Labor and parts are captured per work order, not reconstructed monthly
-
[ ] You can pull trailing 12-month cost for any individual asset in minutes
-
[ ] Your "top assets by cost" list differs from "top by count"
-
[ ] A repair-vs-replace call under a set threshold needs no committee
-
[ ] At least one capital request this year was approved using auto-attached history
-
[ ] You have condition data feeding a forecast for critical assets
-
[ ] Someone owns model validation and checks forecast accuracy
-
[ ] Finance treats your maintenance forecast as fundable, not aspirational
Where your checkmarks stop is roughly where your real stage ends. Everything past that is the next quarter's work.
The roadmap, in plain terms
The sequence that actually works, regardless of facility size:
-
Stabilize capture (Stage 1→2) coding standards, labor at close, non-optional fields. Boring, foundational, non-negotiable.
-
Roll up cost (Stage 2→3) connect work orders to assets to dollars. Build the two "top 10" lists and watch them disagree.
-
Wire the first decision flow (Stage 3) pick repair-vs-replace, set a threshold, remove the debate below it.
-
Introduce forecasting selectively (Stage 3→4) critical assets only, with governance from day one.
-
Integrate with finance (Stage 4→5) make the forecast fundable, tie capex-vs-opex to the same numbers.
Where connected operational software earns its keep is in steps 2 through 4 — keeping work orders, asset history, and cost in one place so the cost rollup and decision flows don't depend on someone manually stitching exports together every month. The analytics are only as trustworthy as the plumbing underneath them, and manual plumbing breaks exactly when you're trying to defend a budget.
Bottom line
A maturity model isn't about reaching Stage 5. It's about making sure your decisions aren't running ahead of your data — or lagging behind it. Plenty of teams have the data to approve repairs faster and defend capital better, and they're still arguing in meetings because nobody wired the analytics into the approval. And plenty of teams are buying predictive tools they can't feed. Figure out what stage you're honestly at. Earn the next decision right before reaching for the one after it. The goal was never prettier dashboards — it's maintenance analytics maturity that actually changes who decides what, and how fast.
Ready to optimize your maintenance operations?
Join 2,000+ facilities using Openfixit to reduce unplanned outages, extend asset life, and improve operational efficiency.