
Spare parts forecasting breaks down fast when you're dealing with equipment that rarely fails. Your critical cooling tower pump needs a rebuild kit maybe twice a year. The backup generator's control board fails once every three years. Standard forecasting methods see these as zeros with occasional spikes, leaving you with either massive overstock or critical shortages at the worst possible time.
The challenge isn't really the math. It's building confidence in probabilistic spare parts forecasting when you have almost no failure data to work with. Maintenance teams need methods that actually function with 5–10 data points, not the hundreds that textbooks assume you have.
Why traditional forecasting fails for maintenance spare parts
Most inventory models were built for retail or manufacturing, where demand is daily or weekly. They fall apart for maintenance parts. A bearing that fails every 400 days looks like noise to a standard algorithm—it either ignores the pattern entirely or overreacts and has you ordering way too much after one event.
What makes spare parts different is the combination of intermittent demand and real consequences. When a specialized valve fails, production stops. You can't swap in something else the way you'd grab a different brand of paper towels.
A few patterns consistently break traditional forecasting in maintenance environments:
Long quiet periods followed by sudden demand. Your HVAC compressor runs fine for 14 months, then needs three contactors replaced in one week. Standard moving averages either see zero demand or excessive demand depending on which window you're looking at.
Small sample sizes that never stabilize. By the time you've collected enough failure data for statistical significance, the equipment might already be obsolete. A circuit board failing every two years gives you maybe five data points before the manufacturer discontinues it.
Cascading failures that create demand clusters. One bearing failure often triggers related failures—seals, shafts, housings. Traditional models treat these as independent events. Your forecast shows one bearing needed. You actually need the whole assembly.
Building probability distributions from minimal data
When you only have 3–7 failure events, you need methods built for small samples. The approach that holds up combines whatever historical data you have with engineering judgment and manufacturer guidance.
Eliminate downtime with proactive maintenance.
Openfixit helps you plan, track, and complete maintenance efficiently—maximizing asset reliability.
- Centralized asset management
- Automated maintenance scheduling
- Inventory and parts tracking
No credit card required
Start with a simple frequency table. Track every failure date and calculate the time between failures. For a chiller compressor motor that's failed four times:
-
Failure 1 to 2
385 days
-
Failure 2 to 3
420 days
-
Failure 3 to 4
365 days
-
Failure 4 to now
290 days (still running)
Instead of averaging these (which gives you 365 days and false precision), build a probability range. Shortest interval was 365 days, longest was 420. There's roughly a 25% chance of failure in each quartile of that range. That's actionable: definitely have a motor by day 365, probably need it by day 390.
For ultra-low frequency items—failures less than once per year—supplement your data with:
Similar equipment at other facilities. That same pump model at your warehouse might fail on a similar schedule. Combine the datasets carefully, since different operating conditions affect failure rates, but it beats working with two data points.
Manufacturer MTBF adjusted for your conditions. If the manufacturer says 5,000 hours MTBF and you're running 24/7 in dusty conditions, you might realistically see 3,500 hours. Use this as a baseline and adjust from actual failures.
Failure mode analysis. A bearing might fail from contamination (random), wear (predictable), or overload (conditional). Understanding which mode dominates helps you pick the right probability distribution. Random failures follow exponential distributions; wear follows normal distributions.
Spreadsheet models that actually work
You don't need specialized software for probabilistic spare parts forecasting. A well-structured spreadsheet handles the majority of maintenance inventory decisions. The key is building it specifically for intermittent demand—not adapting some standard inventory template that wasn't designed for this.
The core calculation structure
Create three sheets: Failure History, Probability Calculations, and Stocking Decisions.
In Failure History, track:
-
Equipment ID and part number
-
Each failure date
-
Days between failures
-
Repair time impact
-
Total cost (parts + labor + downtime)
The Probability Calculations sheet takes those intervals and builds cumulative probability. For each part, calculate:
-
Minimum time to failure (shortest interval you've seen)
-
25th percentile (one quarter of failures happen before this)
-
50th percentile (half of failures)
-
75th percentile (three quarters)
-
Maximum observed
This percentile approach works better than complex distributions when your data is limited. You're essentially saying: based on what we've seen, there's a 75% chance we'll need this part within X days. Simple, defensible, and actually useful.
Risk-adjusted reorder points
The traditional formula—average demand × lead time + safety stock—doesn't really apply here. Instead, calculate:
Probability of failure during lead time. If your lead time is 30 days and there's a 15% chance of failure in any 30-day period, that's your baseline risk.
Cost of stockout versus holding cost. A $200 bearing that costs $5/month to hold but causes $5,000 in downtime should obviously be stocked. Build this ratio for each part.
Criticality multiplier. Some equipment cannot fail. For these, stock at the 90th or 95th percentile of demand. Accept that you'll overstock rather than risk extended downtime.
The formula becomes: Reorder Point = (Probability of failure in lead time) × (Stockout cost / Holding cost ratio) × (Criticality factor)
When that number exceeds 1, stock the part. The higher it goes, the more safety stock you need.
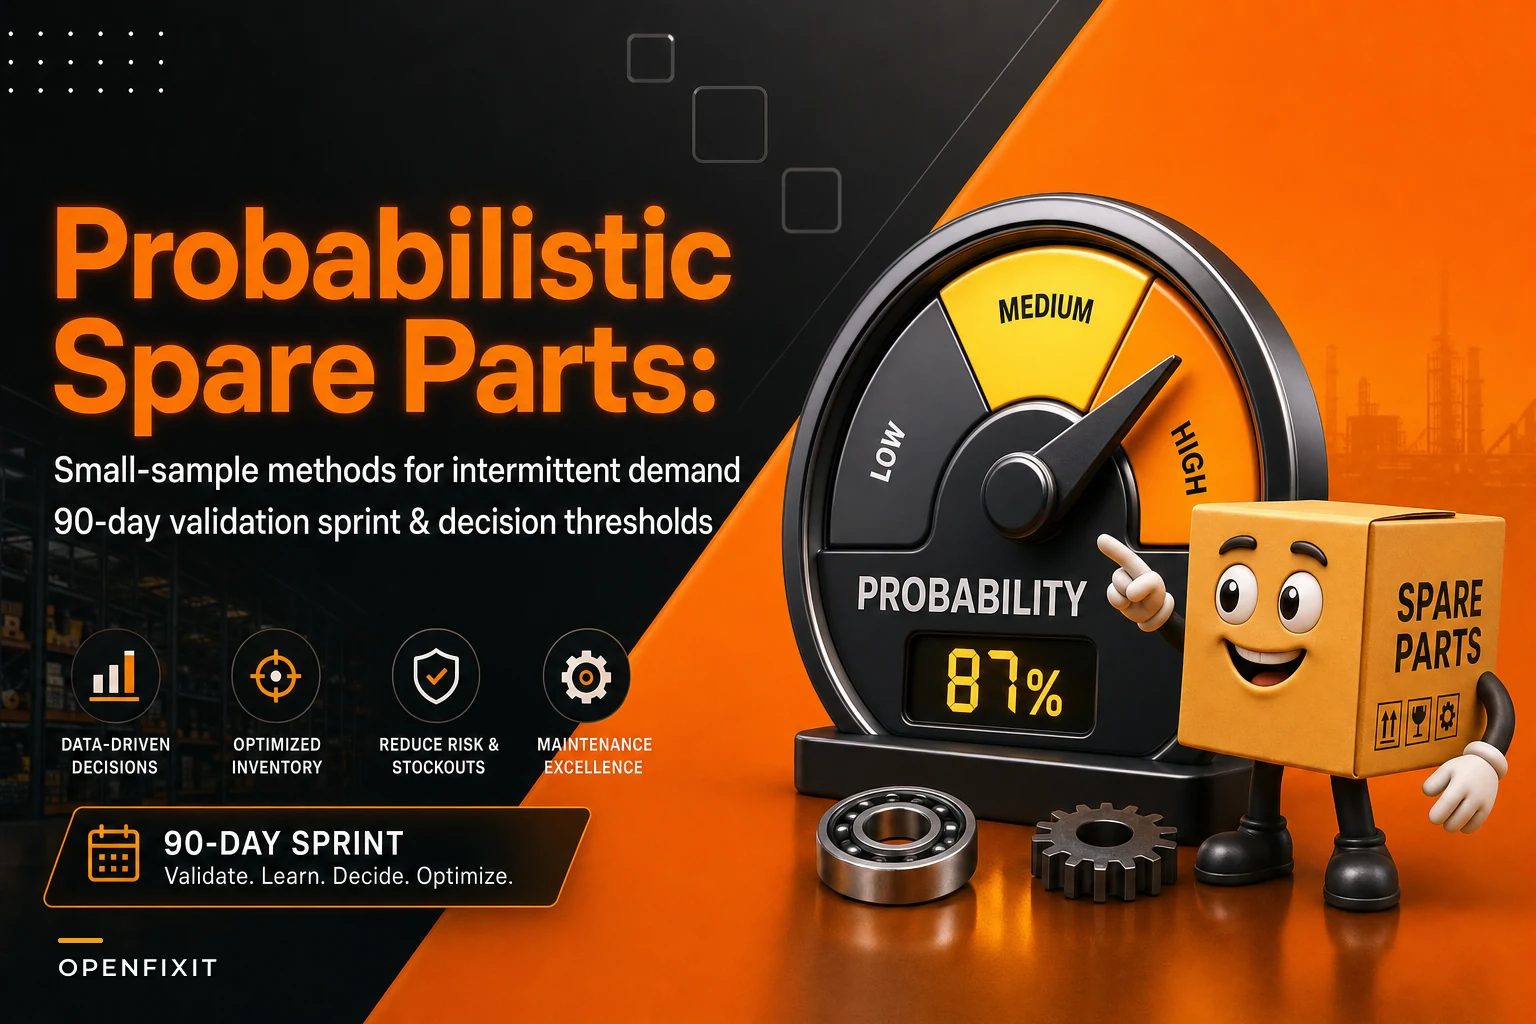
90-day validation sprint
Theory means nothing if it doesn't change actual operations. Below is a validation plan that tests whether your probabilistic approach works without putting critical assets at risk.
Days 1–30: Baseline and setup
Pick 20–30 parts representing different failure patterns:
-
10 high-frequency (fail monthly)
-
10 medium-frequency (fail quarterly)
-
10 low-frequency (fail annually or less)
Document current stocking levels and calculate existing metrics:
-
Stockouts in the last year
-
Current inventory value
-
Average emergency order costs
-
Downtime incidents from parts unavailability
Build your probability models for these parts using the spreadsheet structure above. Don't change actual stocking levels yet—just track what the model recommends versus what you currently do.
Days 31–60: Parallel running
Run your probability model alongside current ordering. When the model says order, note it but follow existing procedures. Track:
-
When the model would have ordered
-
When you actually ordered
-
Any failures that occurred
-
Whether you had stock when needed
This parallel run surfaces gaps without exposing you to risk. You'll find situations where the model would have prevented a stockout and others where it would have ordered unnecessarily. More usefully, you'll see patterns in where the model works and where it needs adjustment.
For each discrepancy, dig into the cause:
-
Was the probability calculation off?
-
Did operating conditions change?
-
Was it a cascade failure you didn't model?
Days 61–90: Limited implementation
Switch 10 parts to the probability model—pick the ones where parallel running showed clear improvement. Keep the other 20 on existing methods as your control group.
Track everything:
-
Stock levels for both groups
-
Stockout incidents
-
Emergency orders required
-
Total inventory cost
By day 90, you have real evidence. Either the probability model reduced stockouts and inventory costs, or it didn't. The small test group limits risk while giving you actual operational data to work from.
Worked examples for different failure patterns
Example 1: Annual replacement bearing
Your main air handler bearing fails roughly annually with this history:
| Interval | Days |
|---|---|
| Interval 1 | 380 |
| Interval 2 | 365 |
| Interval 3 | 395 |
| Interval 4 | 410 |
| Interval 5 | 355 |
Calculate percentiles:
-
Minimum
355 days
-
25th
365 days
-
50th
380 days
-
75th
395 days
-
Maximum
410 days
Lead time: 14 days. Stockout cost: $3,000 (emergency shipping + downtime). Holding cost: $8/month ($96/year). Current age: 340 days since last failure.
At day 340, you're approaching the minimum failure interval. Probability of failure in the next 14 days is roughly 20% based on history. The stockout-to-holding ratio is 31:1—meaning you'd absorb 31 years of holding cost to avoid one stockout.
Decision: order now. Approaching minimum interval plus high stockout cost makes this straightforward.
Example 2: Random electronic failure
Control board failures with no clear pattern:
| Failure | Days Since Last |
|---|---|
| 1 | 89 |
| 2 | 501 |
| 3 | 234 |
| 4 | 790 |
| 5 | 156 |
That scatter suggests random failure, not wear-out. For random failures, use an exponential distribution based on mean time between failures.
Average: 354 days. Daily failure rate: 1/354 = 0.0028. Lead time: 21 days. Probability of failure during lead time: 1 - e^(-0.0028 × 21) = 0.057 (5.7%).
With a 5.7% chance of failure during lead time and moderate stockout cost, you might accept the risk and order on failure. But if this board controls critical equipment, that 5.7% could be unacceptable depending on what downtime actually costs you.
Example 3: Seasonal filter demand
Dust collector filters show a clear seasonal pattern:
-
Summer
2–3 changeouts
-
Winter
0–1 changeout
-
Annual total
6–8 filters
Skip time-based probability here. Use seasonal indexing instead. Calculate what percentage of annual demand falls by month based on historical patterns. If 40% of demand hits June through August, plan accordingly.
For 8 filters annually with 40% summer demand:
-
Summer stocking
4 filters minimum
-
Winter stocking
1–2 filters
-
Reorder triggered by season, not just stock level
Seasonal patterns like this are some of the easiest wins in spare parts planning once you stop treating every month as identical.
Integration with existing CMMS
Probabilistic spare parts forecasting gets more useful when it connects to your maintenance management system. The problem is that most CMMS platforms weren't designed for probabilistic methods—they expect deterministic reorder points and fixed quantities.
A workaround that holds up in practice: maintain your probability calculations in a spreadsheet, but feed simplified outputs to your CMMS. Update reorder points and quantities monthly, then push those fixed values into the system. You get probabilistic planning without trying to force complex calculations into software that wasn't built for it.
Connect your probability model to asset hierarchies you've already standardized. When you know a pump failure typically pulls in seal and bearing replacement, your model can account for those dependent demands.
For parts tied to preventive maintenance, coordinate with your PM interval optimization. If you're extending a PM from 6 months to 8 months based on condition data, your parts forecasting needs to reflect that shift. The bearing you stocked for the 6-month cycle might now carry through multiple intervals.
AI-powered operational platforms can automate these connections in ways spreadsheets can't. Instead of manually refreshing probabilities each month, the software continuously adjusts based on new failure data, flags when patterns shift, and can trigger early orders when risk thresholds are crossed—without anyone having to remember to check.
When probabilistic methods make sense (and when they don't)
Not every part needs this treatment. For consumables used daily—welding rod, cleaning supplies, basic fasteners—traditional min/max stocking is fine. You have plenty of demand data and the consequences of a stockout are manageable.
Probabilistic spare parts forecasting earns its keep in specific situations:
-
Failure is expensive but rare. A $10,000 gearbox failing every two years is a perfect candidate. Traditional methods either ignore it or overstock after a single event.
-
Lead times are long relative to failure intervals. If a part takes six weeks to arrive but might fail any month, you need probability-based planning. Waiting for the failure means extended downtime.
-
You have clusters of related assets. Ten identical pumps with random failures create intermittent but somewhat predictable total demand. Individual failures are random; fleet behavior follows patterns.
-
Historical data exists but is limited. With 3–10 failure events, you have enough for basic probability but not enough for traditional forecasting. This is exactly where simple probabilistic methods outperform both gut-feel and complex statistics.
Skip probabilistic methods when demand is actually predictable—PM parts replaced on a fixed schedule don't need probability modeling, you already know when you'll need them. Also skip it when consequences are minor or when you have no historical data at all. Brand new equipment needs different approaches: manufacturer recommendations, similar equipment analysis, or conservative stocking until patterns develop.
Common mistakes that kill accuracy
The biggest error in probabilistic spare parts forecasting is over-trusting limited data. Four failure points give you direction, not certainty. Operating conditions change, equipment ages, and maintenance practices evolve. Your model needs regular adjustment—not a one-time setup.
Another consistent problem is ignoring failure dependencies. Your model might show low probability for each individual component, but if they tend to fail together, you need all the parts at once. Bearing failures often pull seals and shafts with them. Model these dependencies explicitly or you'll consistently understock during actual failures when it matters most.
There's also a common math error with fleets. If there's a 10% chance of failure this month and you have 10 similar assets, that's not a 100% chance of one failure—it's roughly 65% (1 - 0.9^10). Getting this wrong leads to significant overstocking across your equipment fleet.
The validation window issue catches a lot of teams. They test probabilistic methods for 30 days, see no failures (which is statistically likely for low-frequency items), and conclude the model doesn't work. For low-frequency parts, you need at least one full expected failure cycle to validate—preferably two.
Scaling beyond spreadsheets
Spreadsheet models work well for 50–100 critical parts. Past that, maintenance becomes a real burden. You end up spending more time updating probabilities than actually managing maintenance.
This is where operational software with built-in automation starts making a meaningful difference. AI-powered platforms can track failures automatically, continuously update probability distributions, and adjust for seasonal patterns, equipment age, and changing operating conditions. Instead of monthly spreadsheet updates, probabilities shift based on actual equipment behavior.
Here's a simple workflow visualization.

These platforms also surface correlations that manual analysis tends to miss. A bearing failure might correlate with temperature swings, production volume changes, or specific operating shifts. When condition monitoring data—like vibration readings indicating developing wear—connects to spare parts forecasting, the system can adjust near-term failure probability and trigger early parts ordering before anyone has to think about it. That integration between PM scheduling, work order history, and parts forecasting is where the real value shows up.
Making it stick
Probabilistic spare parts forecasting only works if your team actually uses it. The spreadsheet might be solid, but if technicians don't trust the stocking levels, they'll hoard parts or order extras just in case—which defeats the whole point.
Show technicians the probability calculations and the validation results to build trust quickly.
Track and share wins. Every prevented stockout, every reduced emergency order, every dollar saved from right-sized inventory—document these and communicate them. Teams support systems that make their jobs easier, and they need to see actual evidence before they buy in.
Start with those 20–30 parts in your validation sprint and expand based on what actually worked. Forcing enterprise-wide adoption before proving value is a reliable way to kill the effort before it gets traction.
The path from reactive spare parts management to probabilistic forecasting isn't complicated, but it takes discipline. Build simple probability models, validate with real data, and grow from there. Done right, your maintenance team gets the parts they need when they need them, and you're not sitting on shelves full of stock that hasn't moved in years.
Ready to optimize your maintenance operations?
Join 2,000+ facilities using Openfixit to reduce unplanned outages, extend asset life, and improve operational efficiency.