


Most facility teams don't have a project problem. They have a translation problem. The pump that keeps tripping, the switchgear nobody wants to touch, the three rooftop units limping toward end of life — all of that lives in one language inside the maintenance world, and a completely different language on the finance side. When those two don't connect, good projects die in spreadsheets and bad ones get funded because someone yelled loudest in a budget meeting.
A reliability investment portfolio is the bridge. Not a list of projects. Not a wish list. A structured way to score, bundle, and route reliability work into the fiscal calendar so that by the time it reaches an executive, the decision is already 80% made. This article walks through how that system actually works — scoring logic, bundling thresholds, fiscal-year mapping, and the governance gates that keep the whole thing honest.
If you've already read our project-scoring and bundling matrix for deferred maintenance, think of this as the executive layer that sits on top of it — the part that decides which bundles become capital asks and when.
Why maintenance requests and capital cycles never line up
The friction is structural, not personal. Maintenance runs on a reactive, continuous clock. Something degrades, someone writes a work order, the backlog grows. Capital runs on an annual rhythm with fixed submission windows, approval committees, and a finance team that cares about depreciation schedules and cash timing far more than MTBF.
-
A $140k air handler replacement is "needed now" in March, but the capital window closed in November.
-
The emergency route gets used for things that aren't really emergencies, which quietly inflates opex and burns credibility.
-
Genuinely urgent safety work waits because it got lumped with a batch of nice-to-haves and the whole bundle got deferred.
The teams who get funded aren't usually the ones with the worst equipment. They're the ones who learned to package reliability work in a format the capital process recognizes. Equipment condition matters, obviously — but the framing decides the outcome more often than people want to admit.
This connects directly to how you treat spend categories. If you don't have defendable rules for what's opex versus capex, your scoring is built on sand. Our guide on mapping maintenance budgets to asset lifecycles and finance covers that foundation — the portfolio framework here assumes you already have those lines drawn.
The scoring layer: making dissimilar projects comparable
The whole point of scoring is to let you compare a chiller overhaul against a fire-alarm panel upgrade against a roof membrane replacement — things that have nothing in common operationally — on a single scale an executive can trust.
Eliminate downtime with proactive maintenance.
Openfixit helps you plan, track, and complete maintenance efficiently—maximizing asset reliability.
- Centralized asset management
- Automated maintenance scheduling
- Inventory and parts tracking
No credit card required
Keep the scoring model boring and stable. The moment people think it's tunable to push a pet project through, the whole portfolio loses legitimacy. A workable model usually rests on five weighted dimensions:
| Dimension | Weight | What it actually measures |
|---|---|---|
| Safety / compliance exposure | 30% | Regulatory risk, injury potential, insurance implications |
| Operational / downtime impact | 25% | Revenue or mission impact if the asset fails |
| Failure probability | 20% | Condition data, age vs. design life, failure history |
| Financial return | 15% | Payback, residual value, energy or labor savings |
| Strategic fit | 10% | Site consolidation plans, ESG targets, lease timelines |
A few things that separate a working model from a decorative one:
Safety and compliance carry a hard override. If a project crosses a defined compliance threshold — a code violation with a cited deadline, for example — it doesn't compete on the composite score. It jumps the queue. Scoring is for discretionary reliability work, not for things that can get someone hurt or land you in front of a regulator. Mixing those two creates the exact backlog paralysis you're trying to avoid.
Failure probability needs evidence, not gut feel. This is where most scoring quietly falls apart. "This unit feels like it's on its last legs" is not a score input. Runtime hours, vibration trends, repeat work-order counts, and age against design life are. If your CMMS can't surface those for a given asset in under a minute, your scores will drift toward whoever has the strongest opinion in the room.
Use CMMS runtime hours, vibration trends, and repeat work-order counts as primary scoring inputs rather than subjective impressions.
The financial dimension is weighted lower on purpose. A common mistake is letting ROI dominate. Pure return weighting systematically starves safety and resilience work, because the project with the best payback is rarely the one keeping you out of court. Fifteen percent is enough to break ties and reward genuinely smart economics without letting the spreadsheet run the plant.
Worked example: payback and residual value, done the way finance reads it
Scores get you ranked. Money gets you funded. Finance won't take your word on either.
Here's a realistic example — a repeated-failure centrifugal pump at a mid-size distribution facility.
The situation:
-
Pump is 14 years old against an 18-year design life.
-
Three unplanned failures in the last 20 months, averaging roughly $6k–$7k per event in parts, overtime, and lost throughput.
-
Replacement quote
about $42k installed.
-
New unit is more efficient — estimated energy savings around $3,800/year.
-
Avoided failure cost, based on the trend, is roughly $9k–$11k/year once you factor in rising frequency.
Simple payback:
Annual benefit ≈ $3,800 (energy) + $10,000 (avoided failures) = ~$13,800/year. Payback ≈ $42,000 ÷ $13,800 ≈ 3 years.
That alone is a decent story. But executives also want the residual value picture, because capital isn't just about payback — it's about what's sitting on the books.
Residual value framing:
The old pump is essentially fully depreciated and carries near-zero book value, but it's generating a rising stream of opex charges. The new asset gets depreciated over, say, a 10-year schedule — roughly $4,200/year — which shifts cost off the reactive opex line onto a predictable capital line. For a CFO managing cash and earnings, that conversion from volatile opex to scheduled depreciation is often more persuasive than the payback number itself.
The thing most maintenance teams miss: you're not selling a repair. You're selling a cleaner cost profile. Frame every significant item with both the payback and the opex-to-capital shift, and your approval rate climbs noticeably.
Bundling thresholds: when to combine and when to keep things separate
Bundling is where portfolios get powerful and also where they get people in trouble. Done right, it mobilizes contractors once instead of five times, captures volume pricing, and reduces repeat site disruption. Done wrong, it hides weak projects inside strong ones and gives executives a reason to reject the whole batch.
Set explicit rules so bundling is a system, not a judgment call:
-
Bundle by site and system, not convenience. Combine four rooftop units on one building because the crane, the crew, and the shutdown window are shared. Don't combine a roof project with a parking-lot project just because they're both "exterior."
-
Set a minimum mobilization threshold. If combining projects saves meaningful setup, crane, or travel cost — a useful rule of thumb is anything above roughly 8–12% of the smaller project's value — bundling is justified. Below that, keep them separate so each stands on its own merits.
-
Cap the "weak carry." No bundle should have more than a defined share of low-scoring work riding on high-scoring work. A reasonable guardrail: if more than about 20% of a bundle's cost comes from below-threshold projects, split it. This is the single most important rule for keeping executive trust.
-
Keep safety-override items unbundled. Anything that jumped the queue on compliance grounds gets its own fast track. Bundling urgent safety work with discretionary work slows down the thing that can't afford to wait.
A typical example: a two-site operator had eleven separate HVAC-related requests spread across the year. Unbundled, each looked small and kept getting deferred. Grouped into two site-level bundles aligned to shared shutdown windows, the combined ask told a coherent resilience story, cut mobilization cost by a solid double-digit percentage, and moved from "pile of small opex nuisances" to "one planned capital program." Same work. Completely different reception.
Mapping to the fiscal year: the calendar is a constraint, treat it like one
The most sophisticated scoring model is useless if it delivers its answer two weeks after the capital submission deadline. Fiscal-year mapping is the discipline of running your portfolio cycle backward from the budget calendar.
A practical annual rhythm:
-
Months 1–2 of the fiscal year Refresh the asset condition data feeding failure-probability scores. This is the unglamorous part everyone skips, and it's why so many portfolios run on stale assumptions.
-
Mid-year Score and re-score the active candidate list. Projects that degraded faster than expected move up; ones that got patched move down or drop off.
-
Roughly 3–4 months before the capital window closes Freeze scoring, run bundling, and build the finance packages. Freezing matters — a portfolio that keeps shifting right up to the deadline never produces clean executive packages.
-
Submission window Present ranked bundles with payback and residual framing already attached.
-
Post-approval Anything not funded doesn't vanish. It flows into the deferred register with its score intact, ready to re-enter next cycle — often with a higher score because another year of aging and failures moved the needle.
Visualizing this annual loop helps teams keep the portfolio aligned with the capital calendar.
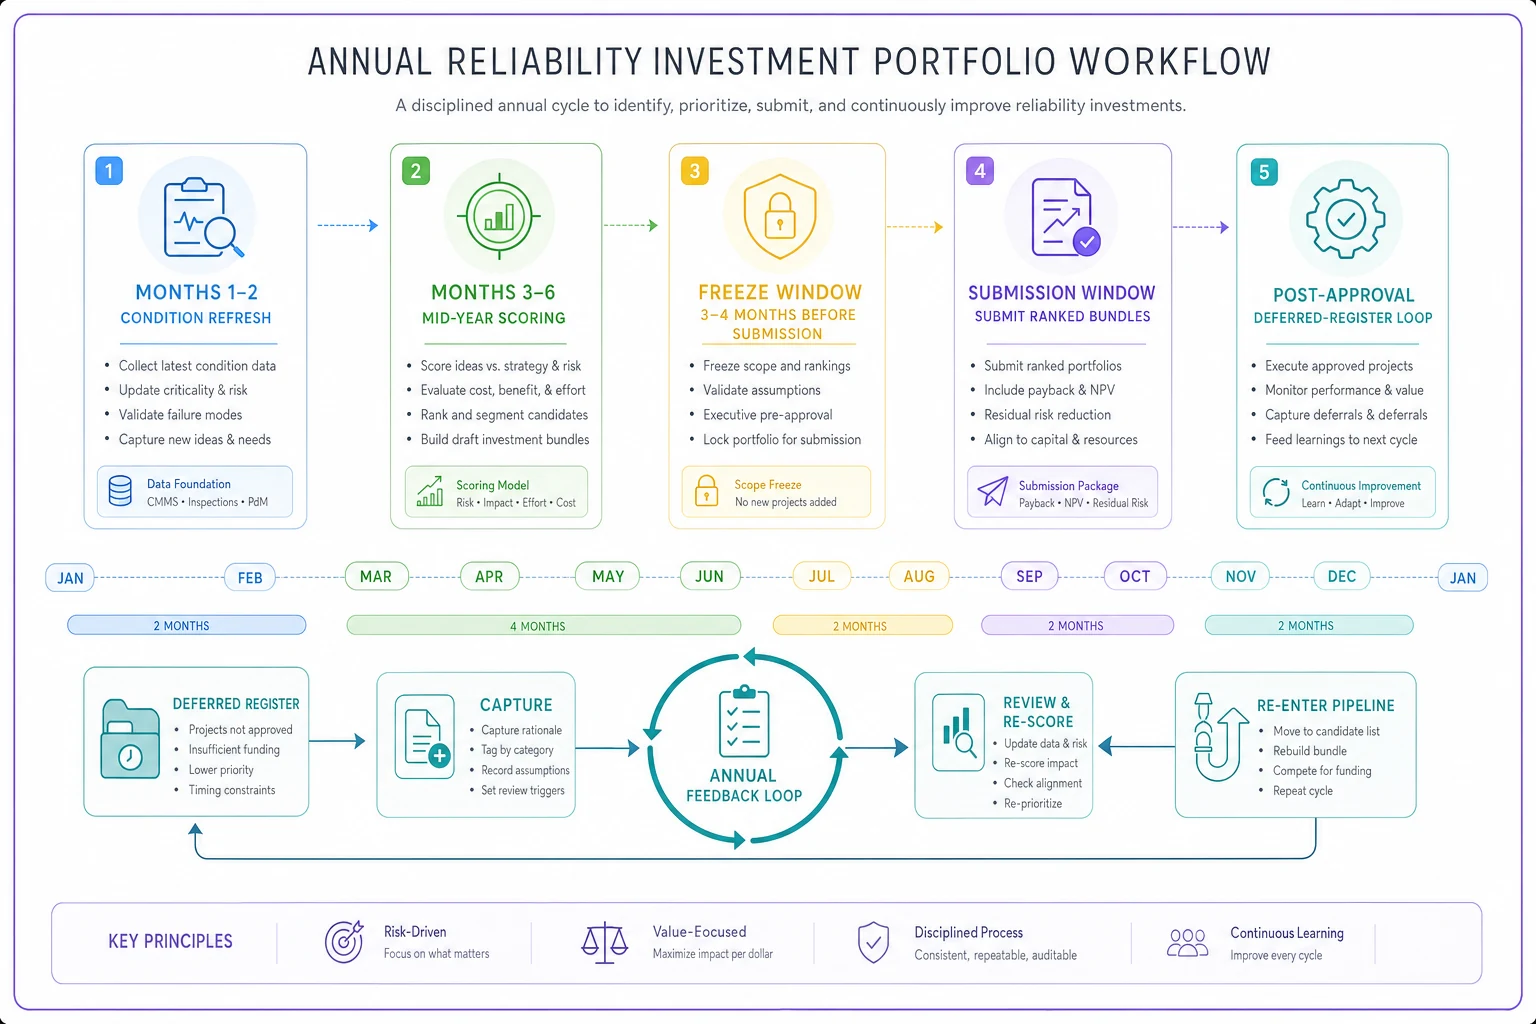
A reliability portfolio is a loop, not a one-time event. Unfunded work is data, not a dead end. Teams that treat rejections as permanent lose the compounding argument that "this got worse while we waited" — which is frequently the strongest case you'll ever make.
Governance gates: who signs off on what, and where
Without gates, two failure modes show up fast. Either everything needs executive approval and the process grinds to a halt, or nothing does and spending leaks everywhere. Gates fix this by tying sign-off authority to dollar thresholds and risk category.
A clean tiered structure:
| Gate | Threshold | Approver | What's required |
|---|---|---|---|
| Gate 1 | Under ~$10k | Facility manager | Scored, logged, within opex plan |
| Gate 2 | ~$10k–$50k | Regional/ops director | Score + basic payback |
| Gate 3 | ~$50k–$250k | Finance + ops leadership | Full package: score, payback, residual, bundle rationale |
| Gate 4 | Above ~$250k | Executive committee / capital board | Gate 3 package + strategic fit + multi-year impact |
No gate-skipping for emergencies without a retro review. Genuine emergencies bypass gates — that's correct. But every bypass gets reviewed afterward. Without that review, "emergency" becomes the standard workaround for a process people find inconvenient, and your capital discipline erodes within a couple of quarters.
Each gate reviews the same package, just at more depth. A Gate 4 item shouldn't need a different document than a Gate 2 item — it needs more of the same document. One consistent format, growing in detail as the dollars grow. This is where a connected CMMS earns its keep: when scoring inputs, work-order history, failure counts, and cost data all live in one system, assembling a Gate 3 or Gate 4 package is a matter of pulling a report, not rebuilding a case from scattered files. The teams who struggle most with capital approvals are almost always the ones hand-assembling evidence from five disconnected tools the week before a deadline.
A short checklist before anything reaches an executive
Run every Gate 3+ item through this before it leaves your desk:
-
- [ ] Scored against all five dimensions with evidence attached, not estimates
-
- [ ] Safety/compliance override status confirmed (in or out of the competitive pool)
-
- [ ] Payback calculated with the actual avoided-failure and savings math shown
-
- [ ] Residual value / opex-to-capital shift stated explicitly
-
- [ ] Bundle composition checked against the weak-carry cap
-
- [ ] Fiscal-year timing confirmed against the submission window
-
- [ ] Deferred-register fallback defined if not funded this cycle
If an item can't clear this list, it's not ready — and sending it up anyway spends credibility you'll want later.
When this framework makes sense — and when it doesn't
It makes sense when you're managing a meaningful portfolio across multiple sites or asset classes, your capital asks regularly compete with each other, and finance has pushed back on maintenance requests as "not rigorous enough." The overhead of scoring and gating pays for itself the moment it wins one bundle that would otherwise have been deferred into a failure.
It's a bad idea when you're a single small site with three or four assets and a small annual capital figure. Building a weighted scoring model and four governance gates for a handful of decisions is bureaucracy theater. Use judgment, keep a simple ranked list, and skip the machinery.
Who should not do this yet: teams without reliable asset data. If your failure counts, runtime hours, and cost history aren't trustworthy, scoring will just launder bad inputs into official-looking numbers — which is worse than no scoring at all, because now the bad call has a spreadsheet behind it. Fix the data foundation first.
Real scenario: a regional operator that stopped losing capital fights
A facilities group running six light-industrial sites kept getting out-maneuvered in the annual budget process. Their maintenance requests went up as one long undifferentiated list — around forty line items — and the executive committee funded maybe a third, usually whatever had the most vocal advocate. Deferred work piled up, emergency spend crept higher each year, and the team felt perpetually behind.
They rebuilt the process around a scored portfolio. Every candidate got run through the five-dimension model using actual CMMS failure and cost data. Items were bundled by site and shared shutdown windows, with the weak-carry cap enforced so no bundle could hide filler. Each Gate 3+ bundle went up with payback and residual framing attached.
The first full cycle after the change, their funded share of requested capital roughly doubled. And — maybe more telling — unplanned emergency spend dropped noticeably over the following year because the genuinely at-risk assets finally got approved on their first ask instead of their third. Nothing about the equipment changed. The translation changed. Finance could finally see what maintenance had been trying to say all along.
The bigger picture
A reliability investment portfolio isn't really about prioritizing projects. It's about building a durable interface between two parts of the organization that measure time, risk, and value in completely different ways. The scoring makes dissimilar work comparable. The bundling makes it efficient to execute and coherent to approve. The fiscal mapping makes sure the answer arrives before the door closes. The governance gates make the whole thing trustworthy enough that executives stop second-guessing and start funding.
Get those four layers working together and the backlog stops being a source of anxiety and starts being a pipeline — a standing argument, refreshed every cycle, for exactly where the next dollar of capital does the most good.
Get those four layers working together and the backlog stops being a source of anxiety and starts being a pipeline — a standing argument, refreshed every cycle, for exactly where the next dollar of capital does the most good.
Ready to optimize your maintenance operations?
Join 2,000+ facilities using Openfixit to reduce unplanned outages, extend asset life, and improve operational efficiency.