


Most multi-site maintenance teams don't have a staffing problem. They have a math problem that shows up as a staffing problem.
The symptoms are familiar: Site A is drowning in overtime while Site C's techs are hiding in the break room. Contractors get called in a panic every August. One region has a great "reputation" for uptime and another gets blamed for everything — but nobody can actually tell you whether that's a people difference or a workload difference. And when someone quits, the default reaction is to backfill the exact same role, because that's what the org chart says exists.
The core issue is that headcount was set at some point in the past, based on buildings and equipment that no longer match reality. Then it drifted. Assets got added. A site expanded. A regional customer changed their SLA. Nobody re-ran the numbers, because there were no numbers to re-run in the first place.
A demand-driven capacity model fixes that by starting from the work — the actual hours of maintenance demand your portfolio generates — and building crews, coverage rules, and contracting decisions on top of it. Here's how the whole thing fits together, and where it tends to break when you scale.
Why Headcount-First Staffing Quietly Falls Apart
Headcount-first planning works fine when you have one building and you can see everything. The manager knows the crew, knows the equipment, and adjusts by feel. That intuition is real and valuable.
It stops working the moment you have five sites in three states and a corporate finance team asking why labor cost per square foot varies by 40% across the portfolio. Feel doesn't travel. The manager at Site B can't feel the workload at Site D, and neither can the VP trying to approve next year's budget.
What happens across a lot of facility portfolios is that the drift compounds in a specific way. A site gets busy, the manager quietly leans on overtime to cover it. Overtime becomes normal. Then it becomes invisible — it's baked into the run rate, so nobody flags it. Meanwhile another site is genuinely overstaffed but never shows up as a problem, because being under budget never triggers an alarm. You end up paying a premium at one site and carrying slack at another, and the two never net out because there's no shared unit of measure connecting them.
That shared unit is the whole point of a demand-driven model. Everything gets converted into hours of demand and hours of available capacity, so you can compare a hospital campus in one region to a distribution center in another without arguing about vibes.
Start by Decomposing the Workload, Not the Org Chart
The foundation is workload decomposition. You break total maintenance demand into buckets that behave differently, because they scale differently and they need different kinds of people.
Eliminate downtime with proactive maintenance.
Openfixit helps you plan, track, and complete maintenance efficiently—maximizing asset reliability.
- Centralized asset management
- Automated maintenance scheduling
- Inventory and parts tracking
No credit card required
-
Planned PM labor — recurring, predictable, schedulable weeks in advance
-
Corrective/reactive labor — driven by failure rates, partly predictable from history
-
Project & capital-adjacent work — installs, upgrades, tenant improvements
-
Compliance & inspection labor — calibrations, safety checks, regulatory items with hard dates
-
Administrative & travel time — the part everyone forgets and then wonders why crews are always behind
-
Standby / on-call coverage — hours you pay for even when nothing breaks
The mistake most teams make is estimating only the first two buckets and treating the rest as noise. In real operations, travel and admin can eat 15–25% of a technician's paid time, especially on multi-building campuses where someone walks ten minutes each way to a satellite structure. If you plan capacity assuming techs are wrenching 8 hours a day, you will be structurally understaffed — and you'll blame it on the people.
Pull the numbers from your CMMS history — completed work order hours by type, by site, over at least 12 months so seasonality is visible. If your historical data is messy (and it usually is), the decomposition step will expose that fast. Consistent asset naming and clean work-order categories matter here a lot. Garbage categories in, garbage FTE numbers out.
Turn Demand into FTEs with a Calculator, Not a Guess
Once you have annual demand hours per bucket per site, converting to full-time equivalents is straightforward arithmetic — but the assumptions inside the arithmetic are where teams get burned.
An FTE isn't 2,080 hours of useful work. After holidays, PTO, sick time, training, safety meetings, and travel/admin overhead, a realistic productive capacity per FTE lands somewhere around 1,400–1,600 hours a year for a hands-on maintenance tech. Plug in 2,080 and you'll consistently under-hire by roughly 20–30%, then close the gap with overtime and emergency contractors — which is exactly the outcome you're trying to escape.
Here's a simplified FTE calculation for a single site:
| Input | Value |
|---|---|
| Planned PM hours/year | 6,200 |
| Corrective hours/year | 4,800 |
| Compliance hours/year | 1,300 |
| Project hours/year | 2,100 |
| Travel + admin loading (+18%) | +2,592 |
| Total demand hours | ~16,992 |
| Productive hours per FTE | 1,500 |
| Raw FTE requirement | ~11.3 |
| Coverage/buffer factor (×1.1) | ~12.4 FTE |
That last buffer line matters. If you staff to exactly the mean demand, you're understaffed roughly half the time by definition. A coverage factor absorbs normal variability so you're not calling contractors every time two techs are out sick in the same week.
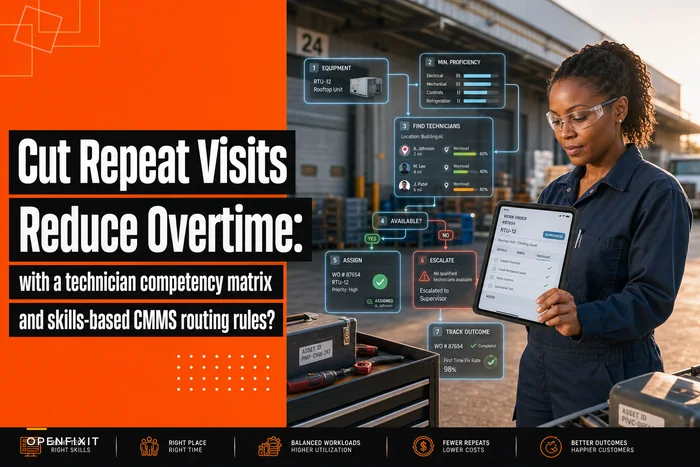
Run this per site, per skill category. A site might need 12 FTE total but be short specifically on controls/HVAC skills while carrying excess general mechanical labor. Total headcount can look fine while the skills are wrong — which shows up as repeat visits and callbacks. If that pattern sounds familiar, the fix is usually routing and skills coverage, not raw headcount; we go deeper on that in the piece on cutting repeat visits with a technician competency matrix.
Cross-Site Coverage Rules: Where the Real Savings Hide
Single-site FTE math is table stakes. The money in a multi-site model comes from not staffing every site for its own peak independently.
If you size each site for its worst week, you've bought peak capacity five times over and it sits idle most of the year. The alternative is treating nearby sites as a shared labor pool with explicit coverage rules — so one site's slack absorbs another's spike.
A workable coverage framework defines a few things clearly:
-
Coverage clusters — which sites are close enough (drive time, not map distance) to share labor practically. If it's 90 minutes each way, it's not a shared pool for day-to-day work.
-
Home vs. flex ratio — e.g., each cluster carries a core of home-site techs plus 1–2 "flex" techs who deploy to whichever site is running hot that week.
-
Trigger thresholds — the backlog or open-WO level that pulls flex labor to a site, and the level that sends it back.
-
Skill-match rules — flex movement only helps if the traveling tech can actually do the work; controls specialists and general techs aren't interchangeable.
A cluster of four sites might each need 8 dedicated FTE if planned independently — 32 total. Pooled, you might run 28 home-site FTE plus 3 flex, hitting the same service level at roughly 31 instead of 32, and with far less overtime because spikes get absorbed by real people instead of premium-rate weekend hours. The savings grow with the number of sites in the cluster.
The failure mode here is coverage rules that exist on paper but nobody enforces, so techs never actually move and each site defends its own crew. Coverage only works if there's a governance cadence forcing the reallocation conversation on a regular schedule.
Seasonal Adjustments: Plan for the Curve, Not the Average
Maintenance demand is not flat. Cooling load hammers HVAC crews in summer. Heating systems demand attention in shoulder seasons. Retail and hospitality portfolios have blackout periods where no disruptive work is allowed at all, which compresses months of work into a smaller window.
Static annual FTE numbers hide all of this. You can be perfectly staffed on an annual average and still be 30% short every July and 30% long every February.
The move is to build a monthly or quarterly demand curve per cluster and staff the baseline with permanent crew, then plan the peak delta with a deliberate mix of overtime, flex labor, and seasonal contractors. The key decision is which of those three tools covers the peak — and that's a governance decision, not something a scheduler should be improvising in the moment.
Governance Gates: Contract vs. Hire, Decided on Purpose
The single most expensive habit in multi-site maintenance is making the contract-vs-hire decision reactively. A site gets slammed, someone calls a contractor, and that "temporary" arrangement runs for three years at a rate that would have paid for a full-time hire twice over.
A demand-driven model puts a governance gate between "we have a capacity gap" and "here's how we fill it." The gate is just a set of questions answered consistently, with the answers driving the decision.
When hiring makes sense
-
The gap is structural and persistent — the demand curve shows it's baseline, not a spike
-
The gap exists most months of the year, not just one season
-
The skill is core to your operation and you want to build institutional knowledge
-
You have management bandwidth to onboard and retain
When contracting makes sense
-
The gap is a defined seasonal peak with a clear start and end
-
The work needs a specialized skill you rarely use (crane work, specialized controls commissioning)
-
You're covering a project spike that won't repeat
-
You need coverage before a permanent hire can realistically be found and trained
When neither is the answer
-
The "gap" is actually a workload distribution problem across your cluster — solve it with coverage rules, not new spend
-
The gap disappears if you fix scheduling and reduce reactive work — throwing bodies at a broken planning process just makes an expensive process bigger
A simple decision gate table keeps this honest:
| Signal | Lean hire | Lean contract |
|---|---|---|
| Gap duration | 9+ months/year | Under 4 months/year |
| Skill frequency | Used weekly | Used a few times/year |
| Predictability | Recurring, planned | One-off or spiky |
| Cost at full utilization | Cheaper as FTE | Cheaper as contract |
| Retention/knowledge value | High | Low |
The gate should have an actual owner and an actual threshold — any contract projected to exceed a set dollar amount or duration triggers a review against these criteria before it gets renewed. Contractors who are well-governed are a genuine asset; contractors who accumulate unchecked are how labor budgets quietly balloon. If your contractor spend has crept up without anyone deciding it should, the work-order-centric vendor governance approach pairs directly with these hiring gates.
How the Pieces Connect as You Scale
At one site, all of this lives in a manager's head and it's fine. The reason it has to become an explicit system is that the connections between the pieces get invisible as you grow.
Workload decomposition feeds the FTE calculators. The FTE calculators reveal per-skill gaps. The gaps get resolved first through cross-site coverage (cheapest), then through the seasonal plan, and only structural, persistent gaps flow to the hire-vs-contract gate. Each layer catches problems the next layer would otherwise solve with money.
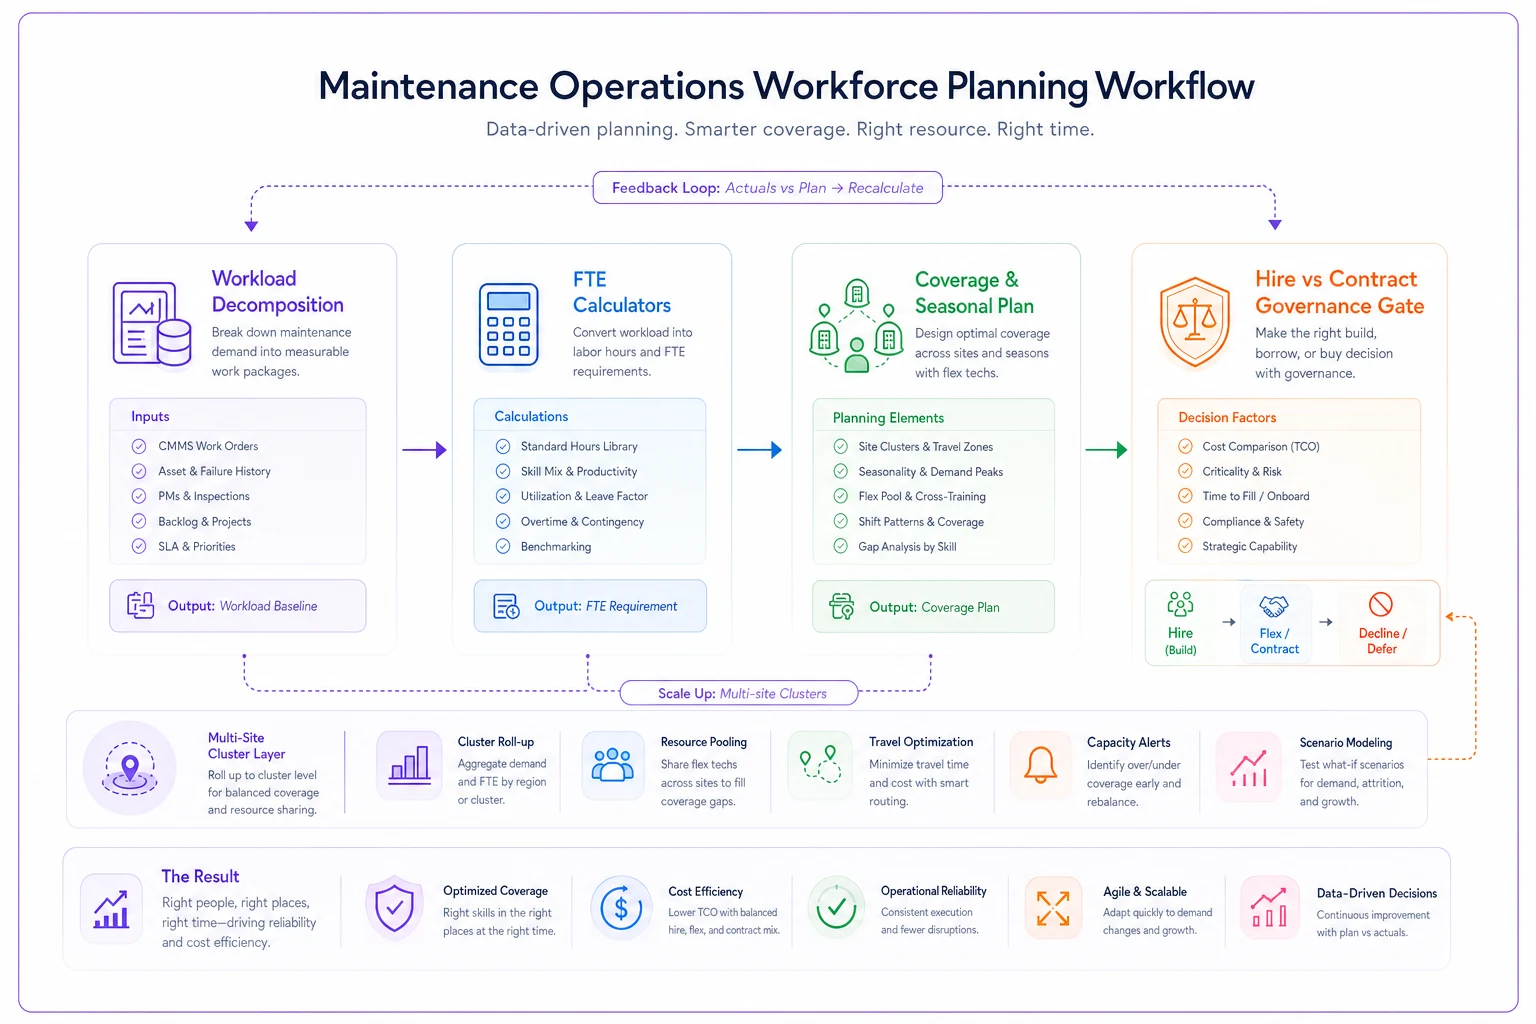
Skip a layer and the whole thing leaks. Teams that jump straight from "we're busy" to "let's hire" without checking coverage end up overstaffed in aggregate while individual sites still feel short. Teams that lean on overtime instead of a seasonal plan burn out their best techs — and losing a senior tech resets your whole capacity math downward. The interplay between backlog, burnout, and capacity is real; if you're already deep in backlog, the humane backlog-clearing playbook with workload guardrails covers the guardrails that keep a capacity model from turning into a speed-up.
This is also where a CMMS earns its keep beyond work orders. The completed-hours history, work-order categories, backlog trends, and per-site labor data are the raw inputs to every calculation above. If that data is clean and categorized, refreshing your capacity model each quarter is a couple of hours of pulling reports. If it isn't, you're back to guessing — which is the state most teams are trying to leave.
A Real Scenario
A regional facilities group ran six commercial properties with a combined maintenance crew of about 40, plus whatever contractors got called during the summer. On paper they were fully staffed. In practice they spent roughly $180k–$210k a year on overtime and had a running summer contractor tab nobody could fully explain.
When they decomposed the workload, two things popped out. First, they'd been planning as if techs delivered around 2,000 productive hours a year; real productive time was closer to 1,500 after travel between buildings on their larger campuses. That single correction explained most of the chronic overtime — they'd been structurally short by several FTE for years and papering over it with weekend hours. Second, two of their six sites were consistently overstaffed relative to demand while two others ran hot every week.
They didn't hire a wave of new people. They reallocated into two coverage clusters with a handful of flex techs, corrected their FTE assumptions and added two permanent hires where the gap was clearly structural, and moved summer HVAC peaks to a pre-contracted seasonal arrangement instead of panic calls at premium rates.
Overtime dropped by more than half within two seasons. The unexplained contractor spend became a planned, budgeted line. And for the first time, when finance asked why one region cost more than another, there was an actual answer: it had more demand hours, not worse people.
Where to Start
You don't need to model the entire portfolio to get value. Pick one cluster, pull 12 months of completed work-order hours by type, run an honest FTE calculation with realistic productive hours, and compare the result to your current headcount and overtime spend. The gap between what the math says and what you're actually doing is usually the whole story — and it's usually large enough that nobody wants to look at it, which is exactly why it stays broken.
Capacity planning isn't a headcount exercise. It's the connective tissue between demand, skills, coverage, and money. Get the demand math right, decide contracting on purpose instead of in a panic, and let nearby sites cover each other — and the understaffing-then-overtime cycle stops being the permanent background noise of running a multi-site team.
Capacity planning isn't a headcount exercise. It's the connective tissue between demand, skills, coverage, and money. Get the demand math right, decide contracting on purpose instead of in a panic, and let nearby sites cover each other — and the understaffing-then-overtime cycle stops being the permanent background noise of running a multi-site team.
Ready to optimize your maintenance operations?
Join 2,000+ facilities using Openfixit to reduce unplanned outages, extend asset life, and improve operational efficiency.